Fig. 1
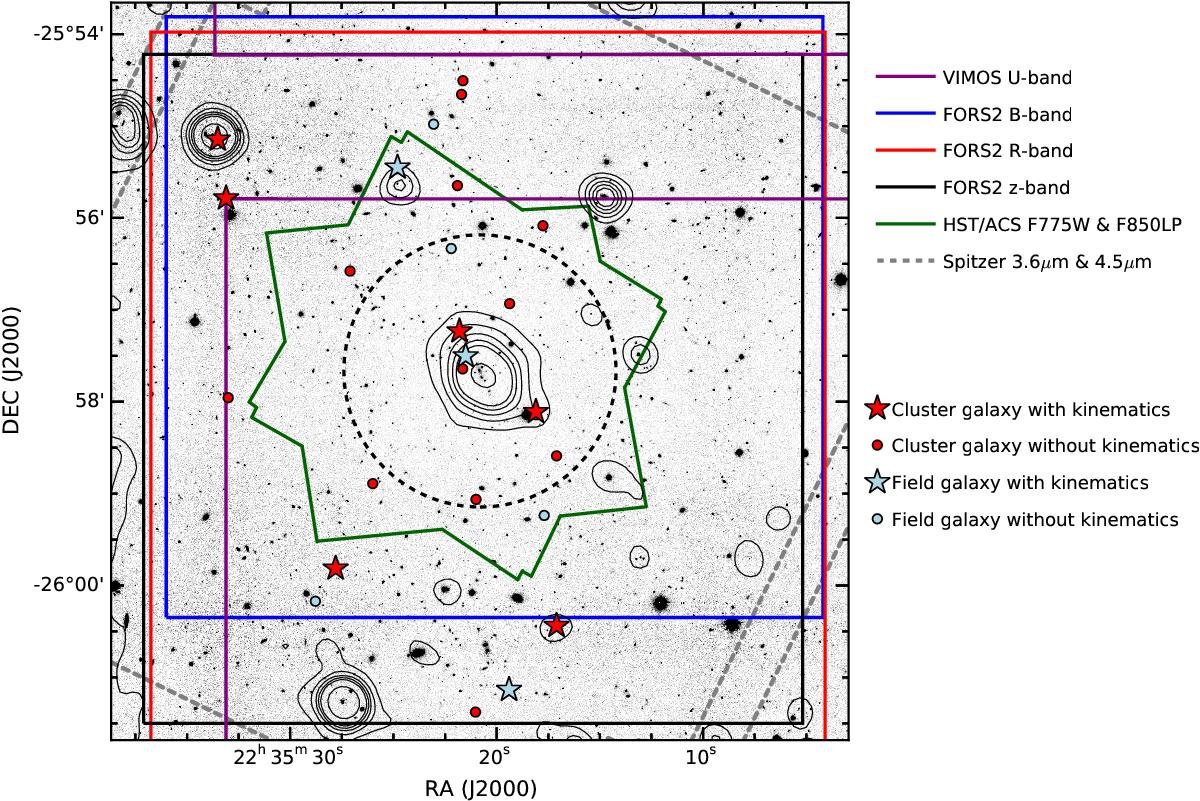
Portion (8.25 × 8.25 arcmin2) of the J-band HAWKI image with XMM-Newton X-ray contours overlayed. The field of view of the different instruments used in this work is also shown. The HAWKI J and Ks and ISPI H-band observations cover a field of view much larger than the figure. The FORS2 B-, R- and z-band coverage was obtained from different ESO programs. Most of the X-ray sources are likely distant AGNs, but the extended emission associated with the cluster can be appreciated in the center. The dashed circle marks the R500 = 0.75 Mpc radius derived by Rosati et al. (2009). We denote the position of the galaxies analyzed in this study by distinguishing between field and cluster and between those that yielded a Vmax value and those that did not.
Current usage metrics show cumulative count of Article Views (full-text article views including HTML views, PDF and ePub downloads, according to the available data) and Abstracts Views on Vision4Press platform.
Data correspond to usage on the plateform after 2015. The current usage metrics is available 48-96 hours after online publication and is updated daily on week days.
Initial download of the metrics may take a while.