Fig. 9
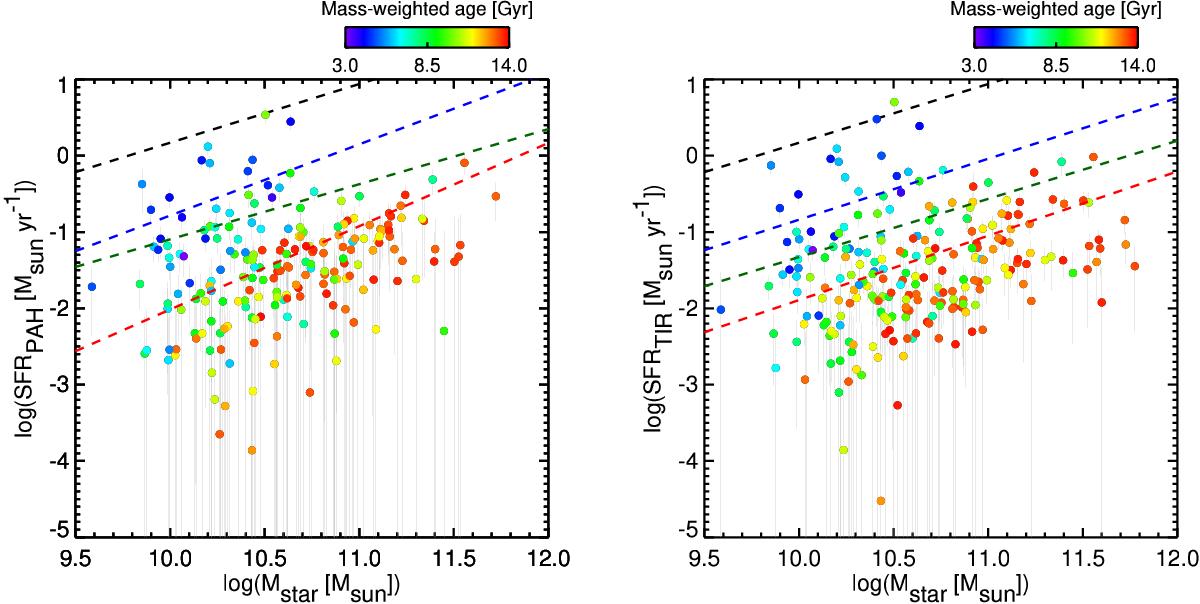
Correlations between the star formation rates (PAH- and TIR-derived) and stellar masses of the 231 successfully fitted ATLAS3D galaxies. Data points are colour coded according to their mass-weighted stellar population age (McDermid et al. 2015). Dotted black lines show the star formation main sequence of local star-forming galaxies (Elbaz et al. 2007). Dotted blue, green, and red lines show the best linear fits for the age range 3–7, 7–11, and 11–14 Gyr, respectively.
Current usage metrics show cumulative count of Article Views (full-text article views including HTML views, PDF and ePub downloads, according to the available data) and Abstracts Views on Vision4Press platform.
Data correspond to usage on the plateform after 2015. The current usage metrics is available 48-96 hours after online publication and is updated daily on week days.
Initial download of the metrics may take a while.