Fig. 7
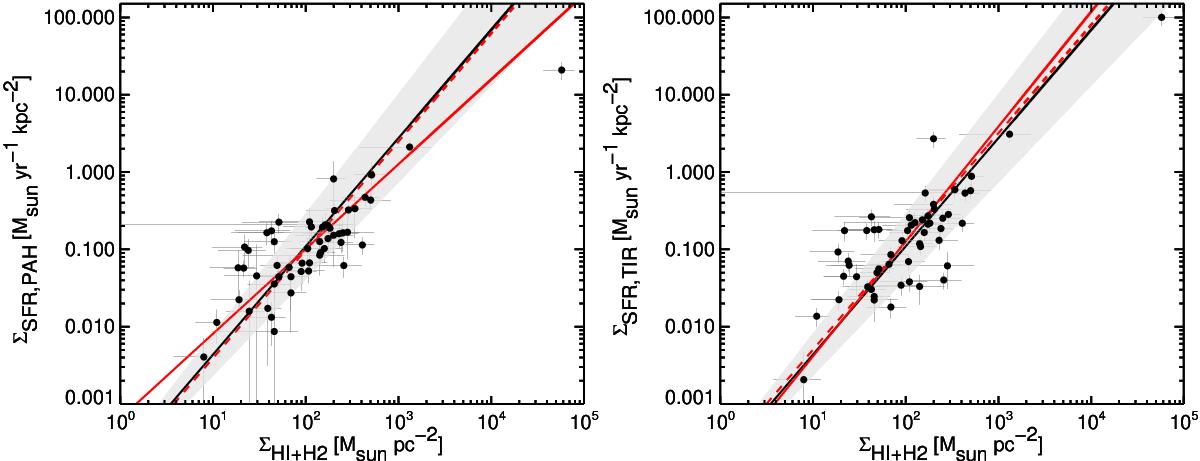
Star formation rates (PAH- and TIR-derived) vs. total gas surface densities (i.e. KS law) for CO-detected galaxies. Solid black lines and shaded grey regions show the Kennicutt (1998) relation for local star-forming galaxies (with power-law index n = 1.4) and its intrinsic scatter, respectively. Solid and dashed red lines show the best linear fits with free and fixed (n = 1.4) slope, respectively. The galaxy located in the top right of each panel is NGC 1266, which is known to have strongly suppressed star formation. It was excluded from the fits.
Current usage metrics show cumulative count of Article Views (full-text article views including HTML views, PDF and ePub downloads, according to the available data) and Abstracts Views on Vision4Press platform.
Data correspond to usage on the plateform after 2015. The current usage metrics is available 48-96 hours after online publication and is updated daily on week days.
Initial download of the metrics may take a while.