Fig. 5
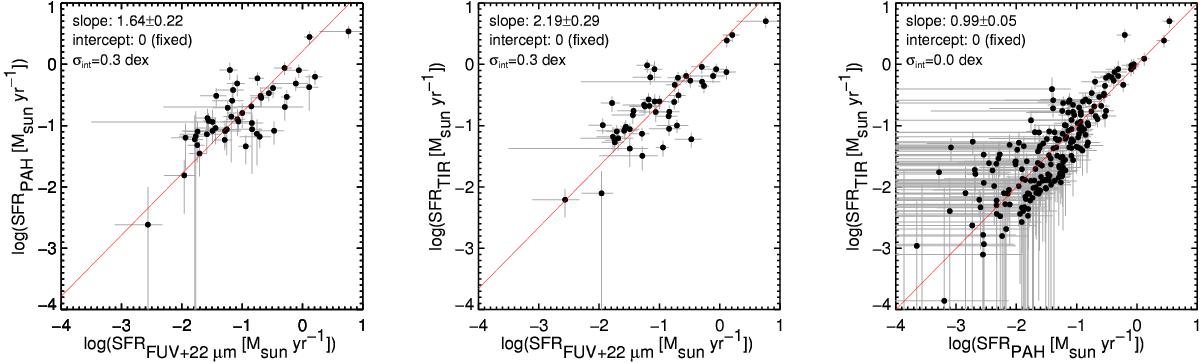
Comparisons of our PAH- and TIR-derived star formation rates and the FUV+22μm star formation rates of Davis et al. (2014), the latter for CO-detected galaxies only. Solid red lines show the best-fit linear relations with nul intercepts, while the labels list the best-fit slopes, fixed intercepts, and intrinsic scatters around the best-fit relations.
Current usage metrics show cumulative count of Article Views (full-text article views including HTML views, PDF and ePub downloads, according to the available data) and Abstracts Views on Vision4Press platform.
Data correspond to usage on the plateform after 2015. The current usage metrics is available 48-96 hours after online publication and is updated daily on week days.
Initial download of the metrics may take a while.