Fig. 3
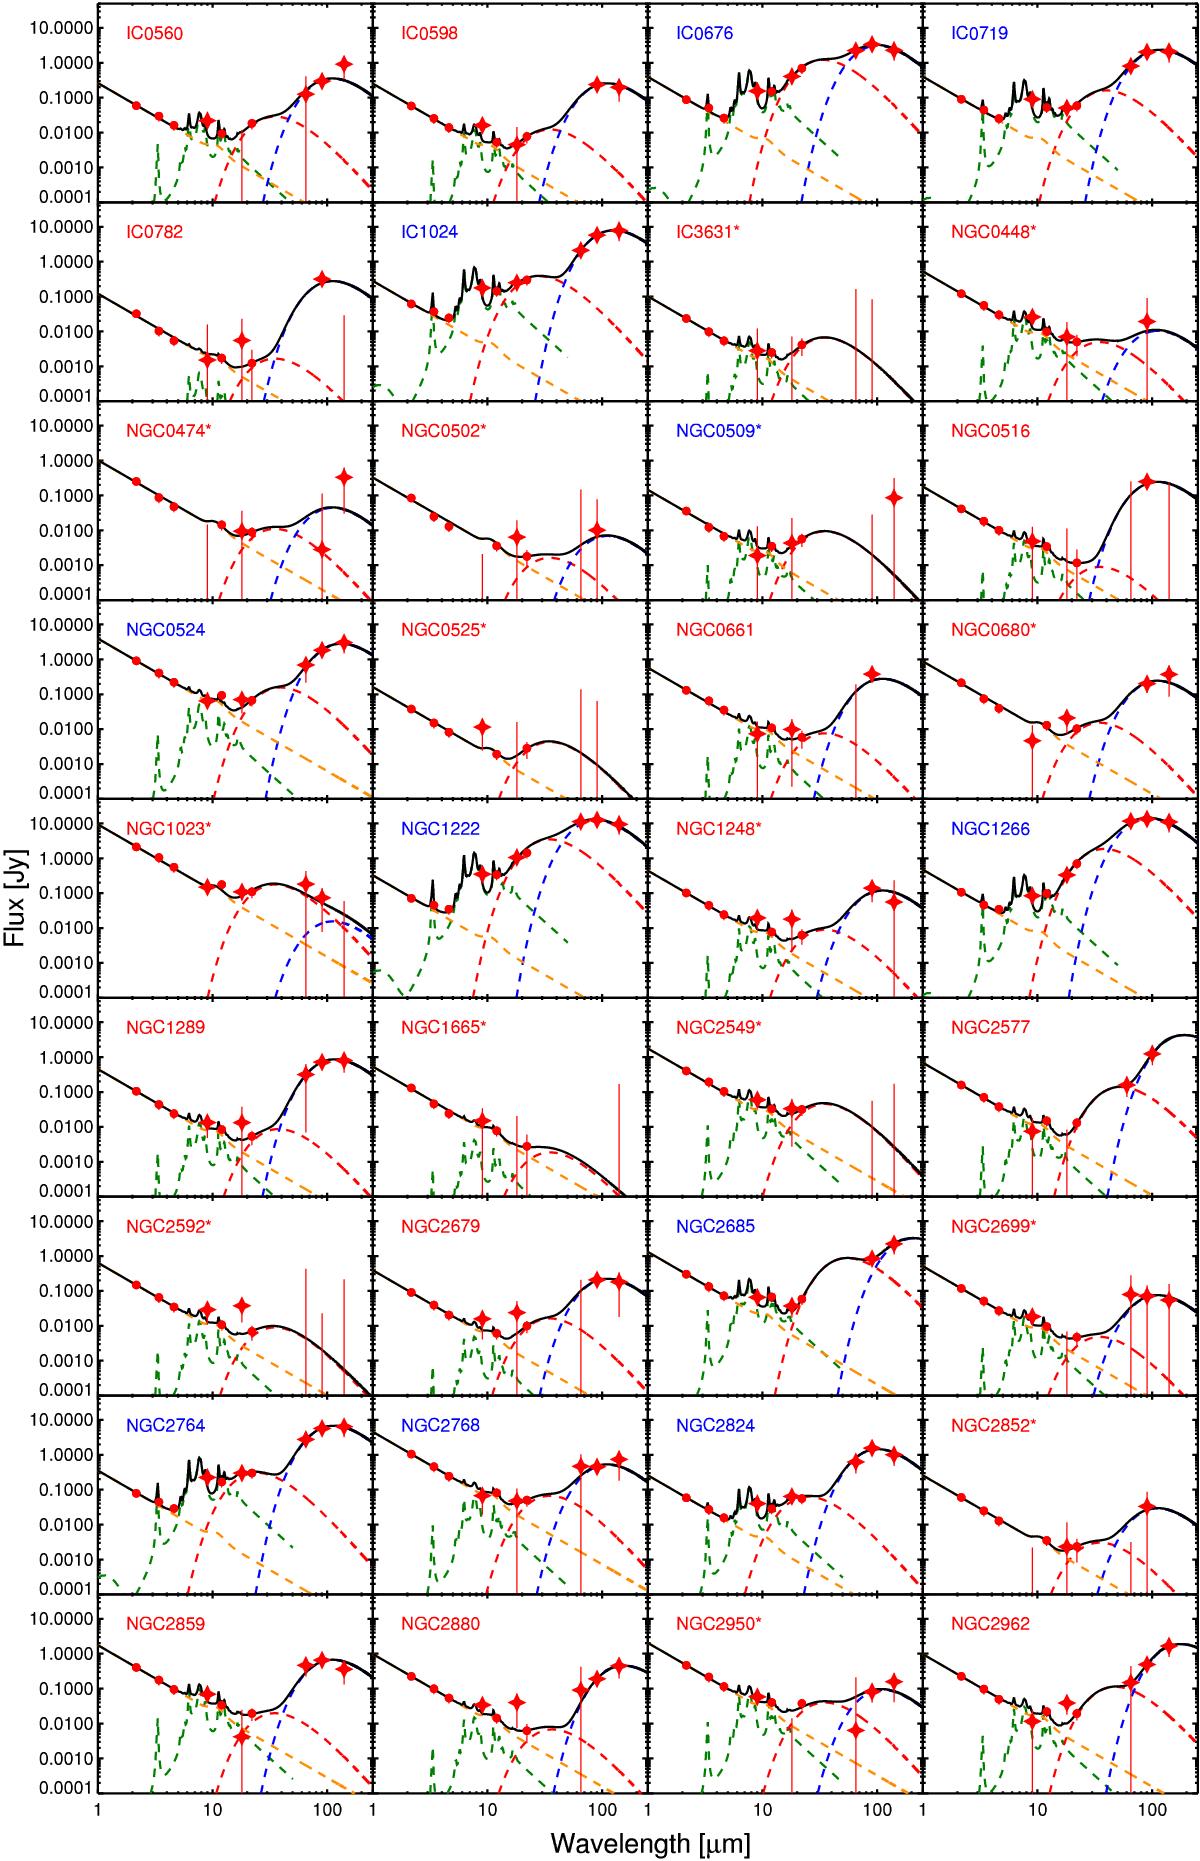
Observed spectral energy distributions (red data points) overlaid with the best-fit spectral models (solid black lines) for the 231 successfully fitted ATLAS3D galaxies. AKARI data points are shown as stars; other data points are shown as filled circles. Dotted orange, green, red, and blue lines indicate the best-fit stellar, PAH, warm, and cold dust component, respectively. The name of the galaxy is indicated in the top left corner of each panel, in blue for CO-detected galaxies and red for non-CO-detected galaxies. Galaxies with no AKARI FIR (65, 90 or 140μm) detection are marked with an asterisk. The full figure is available in Appendix B.
Current usage metrics show cumulative count of Article Views (full-text article views including HTML views, PDF and ePub downloads, according to the available data) and Abstracts Views on Vision4Press platform.
Data correspond to usage on the plateform after 2015. The current usage metrics is available 48-96 hours after online publication and is updated daily on week days.
Initial download of the metrics may take a while.