Fig. 2
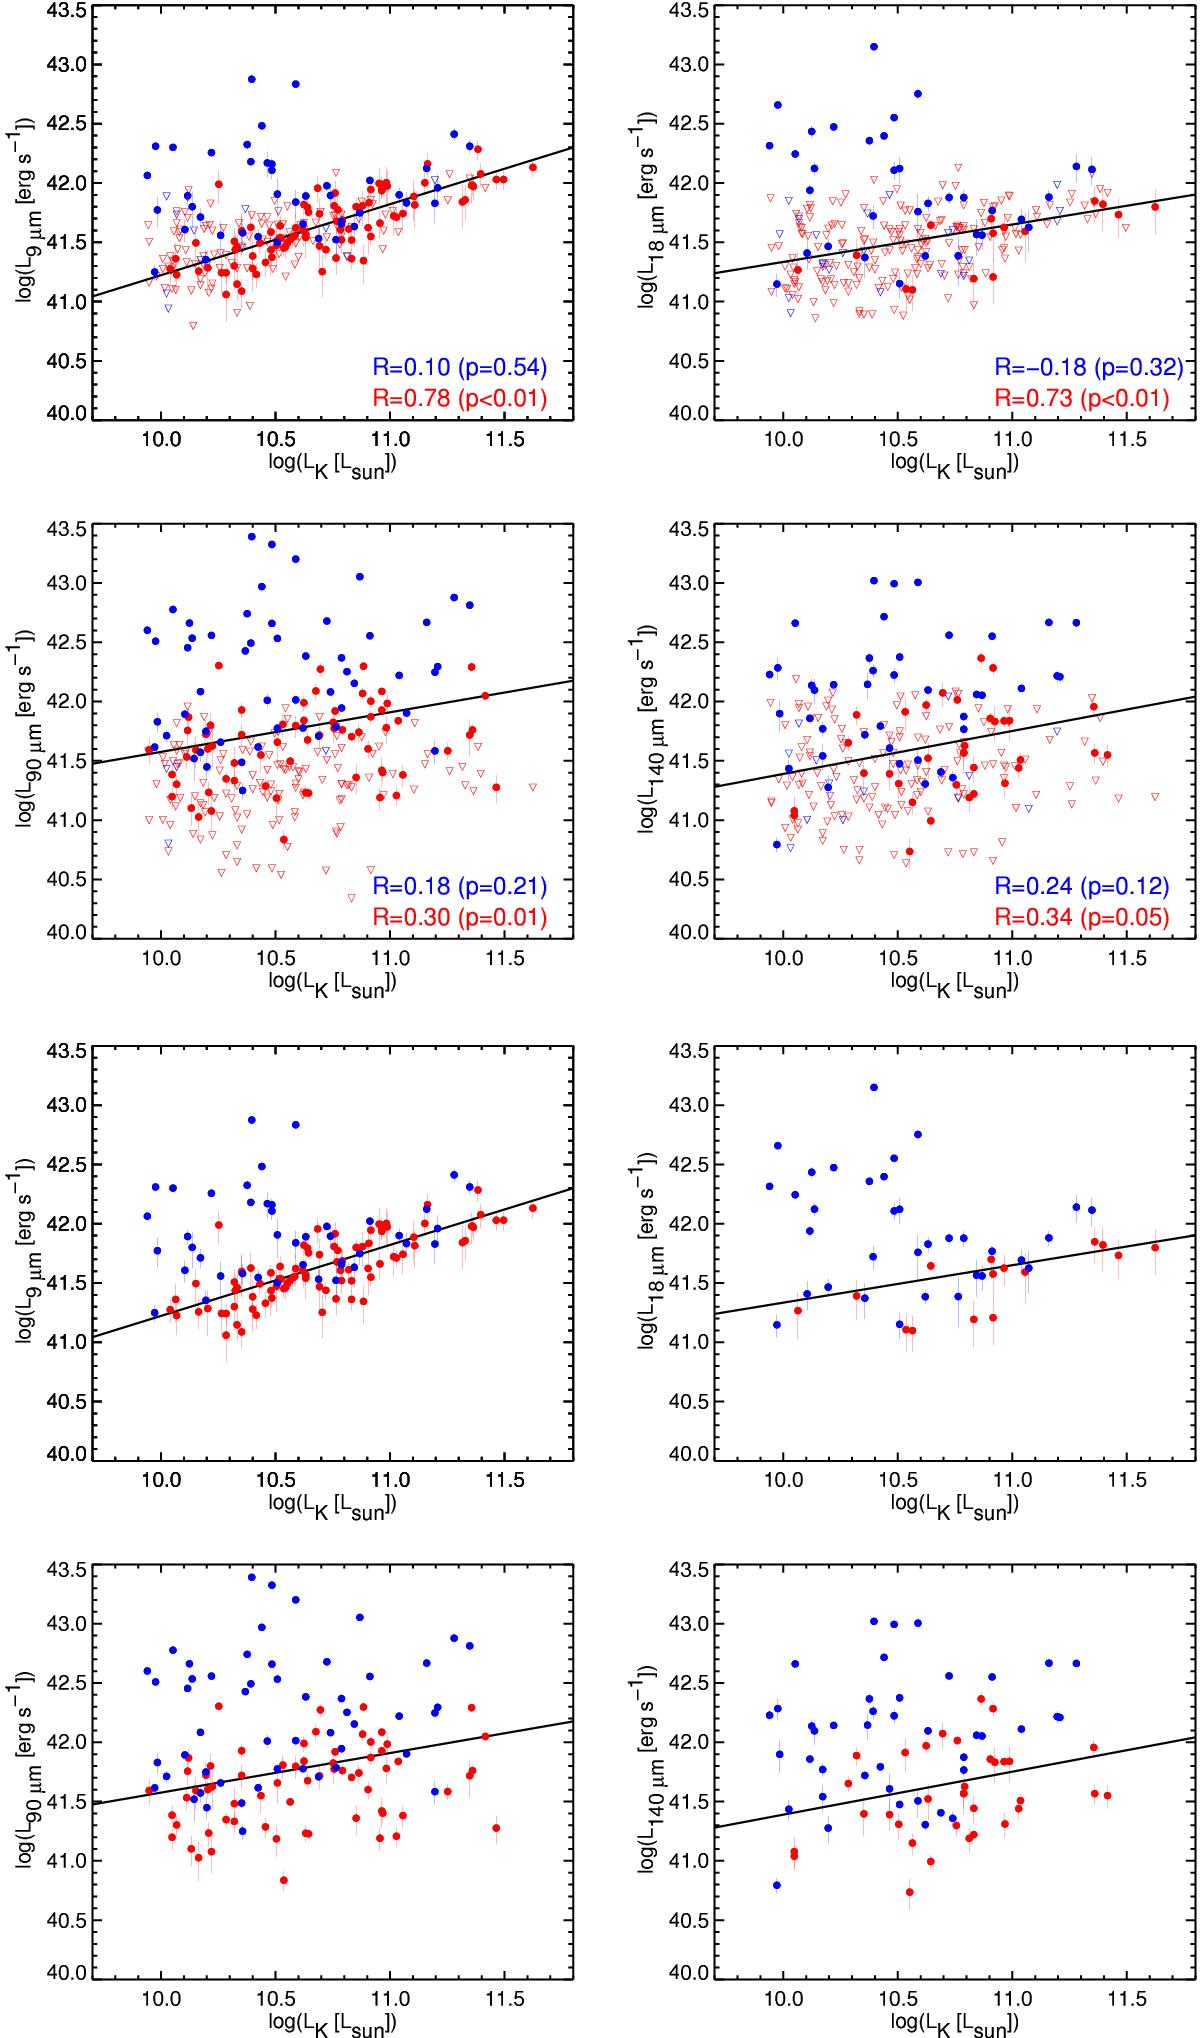
Total 9, 18, 90, and 140μm luminosities vs. total Ks-band luminosities for IR measurements with S/N > 2.4, 2.2, 2.7, and 2.8, respectively (solid circles). Conversely, open triangles indicate 2.4, 2.2, 2.7, and 2.8σ upper limits, respectively. Blue and red data points denote CO-detected and non-CO-detected galaxies, respectively. Linear correlation coefficients (R) and p-values for CO-detected and non-CO-detected galaxies are indicated in blue and red, respectively, for galaxies above the stated S/N thresholds. Solid black lines show the best linear fits to the non-CO-detected galaxies only, excluding upper limits (see Table 2). The bottom four panels are the same as the top four panels, but without upper limits.
Current usage metrics show cumulative count of Article Views (full-text article views including HTML views, PDF and ePub downloads, according to the available data) and Abstracts Views on Vision4Press platform.
Data correspond to usage on the plateform after 2015. The current usage metrics is available 48-96 hours after online publication and is updated daily on week days.
Initial download of the metrics may take a while.