Fig. 6
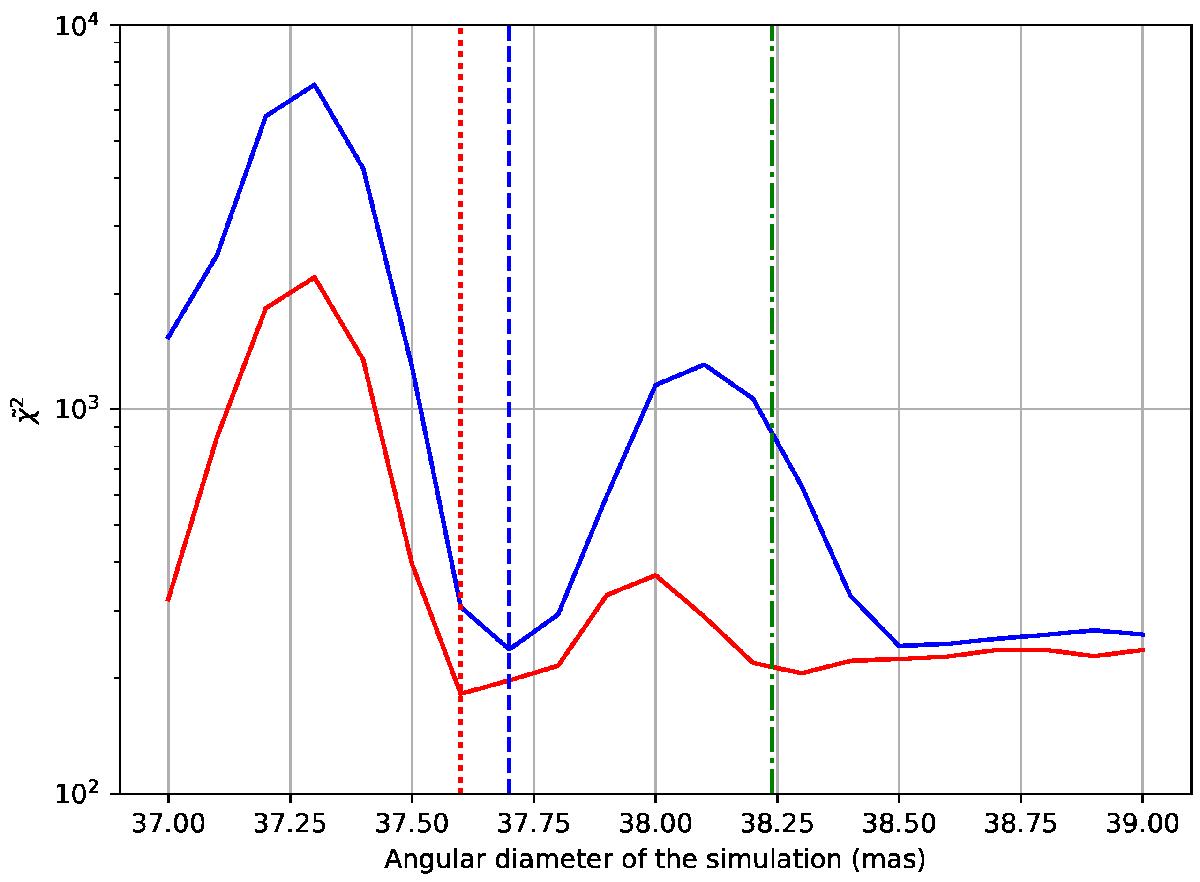
Mean (blue) and minimum (red) ![]() computed over the whole rotation angles of the best matching snapshot of simulation st35gm03n13, as a function of the simulation angular diameter at 1.61 μm. The red vertical dotted line corresponds to the diameter associated to the minimum of the continuous red curve. The blue vertical dashed line corresponds to the diameter associated to the minimum of the continuous blue curve. The green vertical dash-dotted line corresponds to the best LDD angular diameter obtained in Sect. 3.1. The
computed over the whole rotation angles of the best matching snapshot of simulation st35gm03n13, as a function of the simulation angular diameter at 1.61 μm. The red vertical dotted line corresponds to the diameter associated to the minimum of the continuous red curve. The blue vertical dashed line corresponds to the diameter associated to the minimum of the continuous blue curve. The green vertical dash-dotted line corresponds to the best LDD angular diameter obtained in Sect. 3.1. The ![]() is computed over the entire squared visibility dataset.
is computed over the entire squared visibility dataset.
Current usage metrics show cumulative count of Article Views (full-text article views including HTML views, PDF and ePub downloads, according to the available data) and Abstracts Views on Vision4Press platform.
Data correspond to usage on the plateform after 2015. The current usage metrics is available 48-96 hours after online publication and is updated daily on week days.
Initial download of the metrics may take a while.