Fig. 5
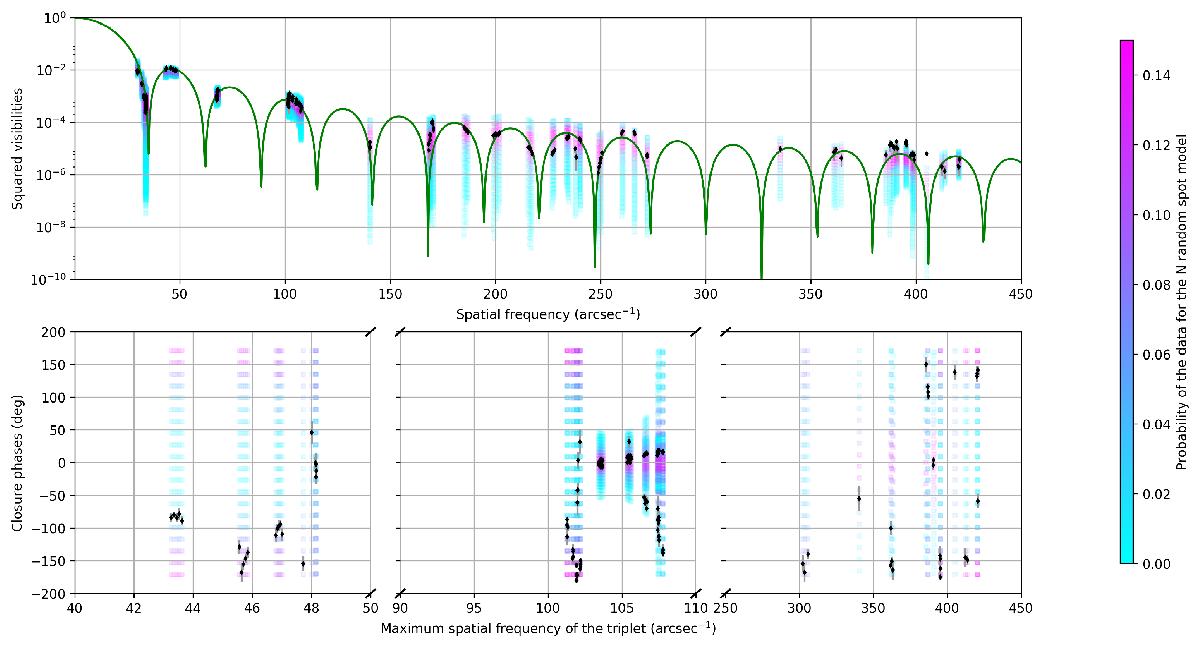
Interferometric observables measured on Antares by VLTI/PIONIER at 1.61 μm (black points). The green curve corresponds to a LDD power-law model of 37.89 mas in diameter and a LD exponent of 0.52. The color points represent the probability of the observables computed for 1000 iterations of a LDD power law model of 37.89 mas in diameter and a LD exponent of 0.52 with two distributions of bright Gaussian spots. The first has spots with a FWHM of 17 mas, a filling factor of 0.5 and a contribution of 3% to the total intensity. The second has spots with a FWHM of 2 mas, a filling factor of 0.4 and a contribution of 10% to the total intensity. Top panel: squared visibilities. Bottom panel: closure phases. The spatial frequency domain is fragmented to zoom onto each data range.
Current usage metrics show cumulative count of Article Views (full-text article views including HTML views, PDF and ePub downloads, according to the available data) and Abstracts Views on Vision4Press platform.
Data correspond to usage on the plateform after 2015. The current usage metrics is available 48-96 hours after online publication and is updated daily on week days.
Initial download of the metrics may take a while.