Fig. 9
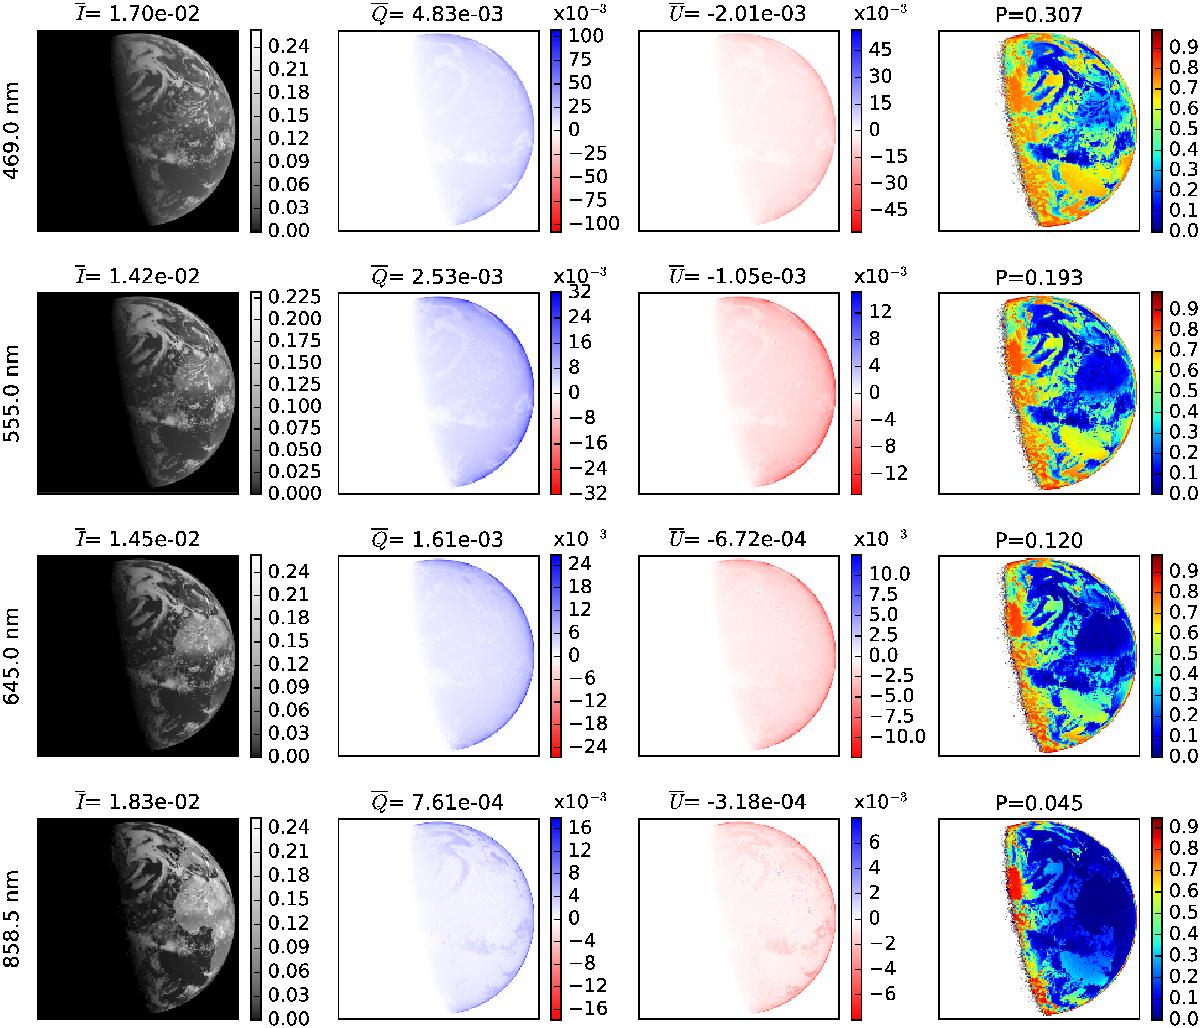
Simulations of the Earth as seen by the moon on 25 April 2011 at 9:00 UTC. The cloud fields (liquid and ice clouds) are taken from the ECMWF IFS weather forecast model. The surface is included as a 2D albedo map derived from MODIS observations. The rows correspond to the central wavelengths of MODIS channels. The left plots show the radiance I, the middle plots show the linear polarization components Q and U, and the right plot shows the degree of polarization P. The numbers on top of the figures indicate the averages for I, Q, and U and the degree of polarization of the complete image.
Current usage metrics show cumulative count of Article Views (full-text article views including HTML views, PDF and ePub downloads, according to the available data) and Abstracts Views on Vision4Press platform.
Data correspond to usage on the plateform after 2015. The current usage metrics is available 48-96 hours after online publication and is updated daily on week days.
Initial download of the metrics may take a while.