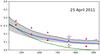
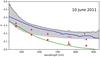
Fig. 8
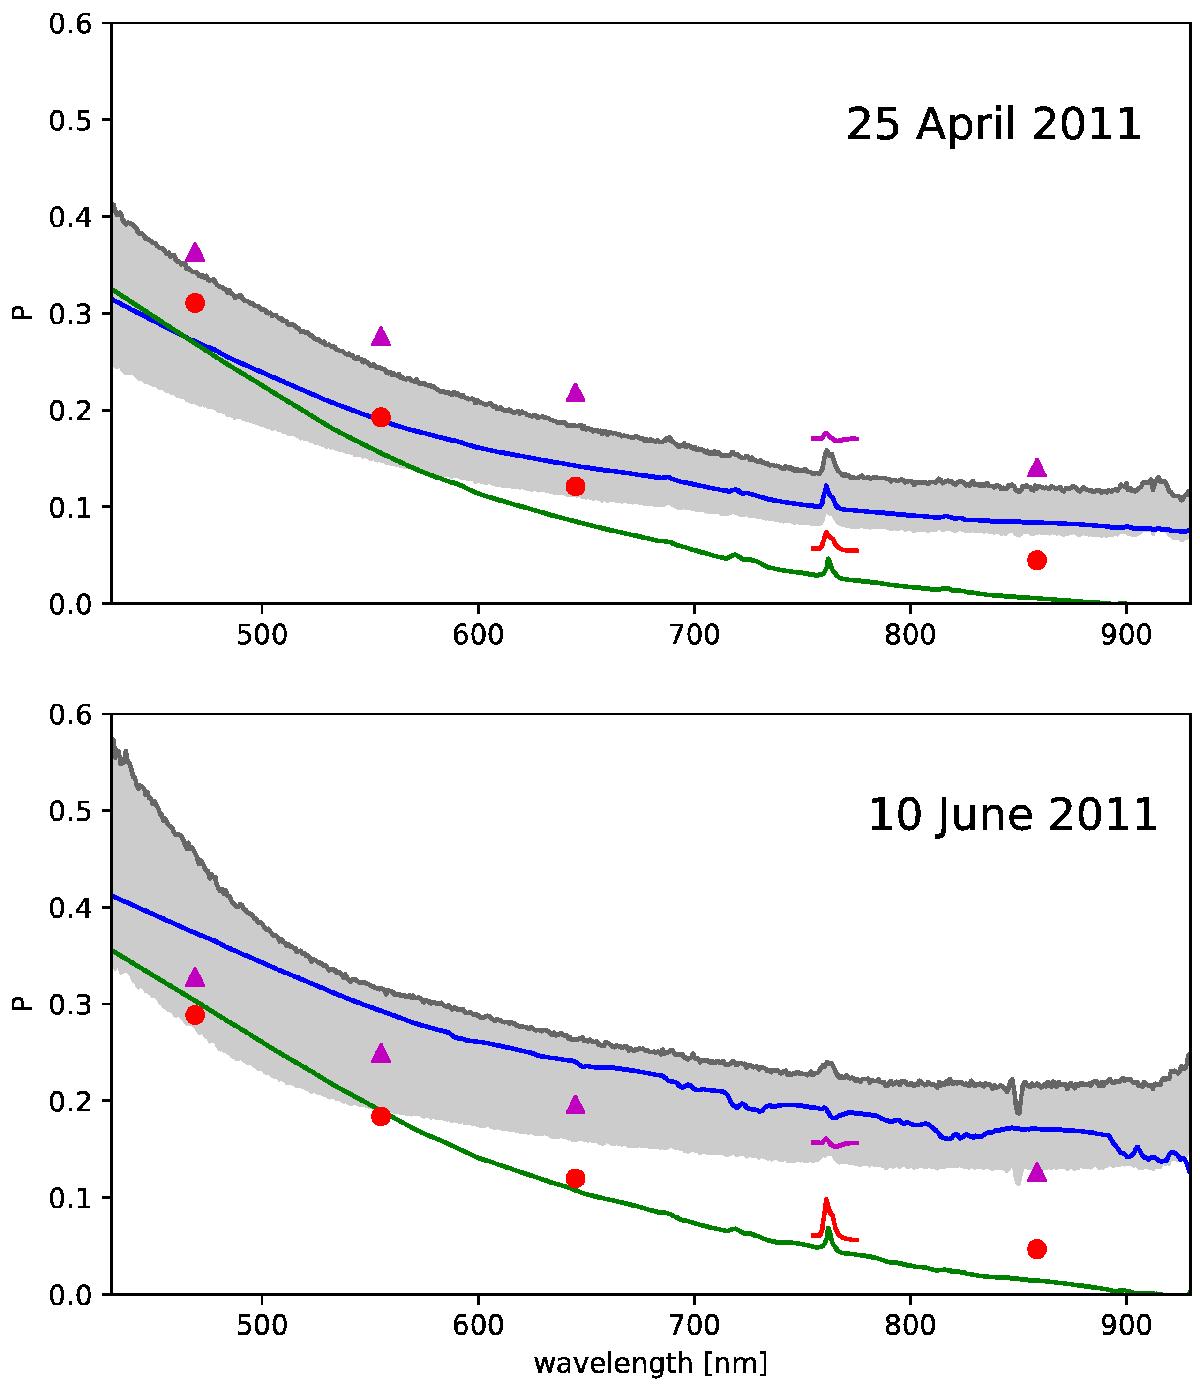
Observations by FORS against MYSTIC simulations (see text for details). The blue lines correspond to simulations for homogeneous planets, which are averaged using a weighted sum approach (see Sect. 6.1). The red circles correspond to simulations for a realistic Earth model including 3D cloud fields and a 2D surface albedo map derived from MODIS data (see Sect. 6.2.1). The purple triangles indicate a planet with the same 3D cloud fields, but the surface is completely covered with ocean and simulated using a BPDF (see Sect. 6.2.2). The gray area shows the uncertainty range due to the unknown moon depolarization. The green line shows the best fit, which was obtained using the dataset by Stam (2008) without ice clouds (see Sterzik et al. 2012). The top panel represents the observation on 25 April 2011 and the bottom panel 10 June 2011.
Current usage metrics show cumulative count of Article Views (full-text article views including HTML views, PDF and ePub downloads, according to the available data) and Abstracts Views on Vision4Press platform.
Data correspond to usage on the plateform after 2015. The current usage metrics is available 48-96 hours after online publication and is updated daily on week days.
Initial download of the metrics may take a while.