Fig. 4
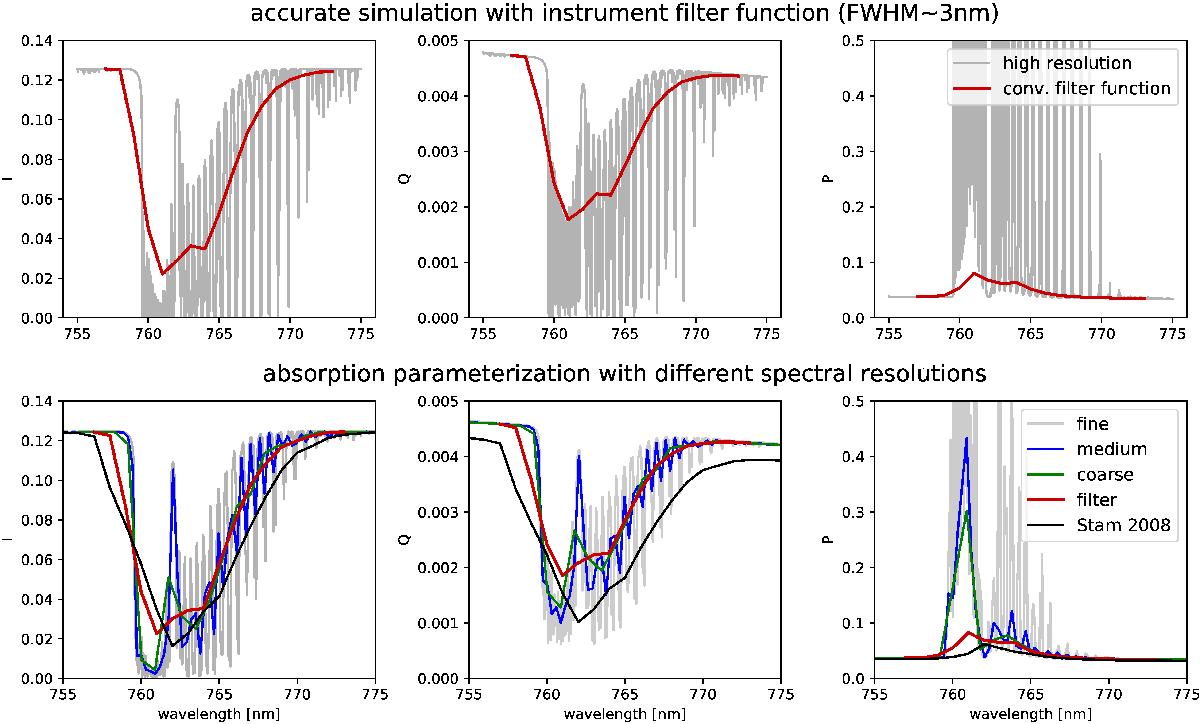
Intensity I, Stokes parameter Q, and degree of polarization P = Q/I in the O2A band region. The top plots show high spectral resolution calculations with Δλ = 0.01 nm and the spectrum convolved with the instrument filter function. The bottom plots show the same spectral region calculated using the REPTRAN parameterization in three spectral resolutions (fine, medium, and coarse). The red line shows the REPTRAN calculation in coarse resolution convolved with the instrument filter function. For comparison, the data from Stam (2008) are also shown. The Lambertian surface albedo is 0.6.
Current usage metrics show cumulative count of Article Views (full-text article views including HTML views, PDF and ePub downloads, according to the available data) and Abstracts Views on Vision4Press platform.
Data correspond to usage on the plateform after 2015. The current usage metrics is available 48-96 hours after online publication and is updated daily on week days.
Initial download of the metrics may take a while.