Fig. 8
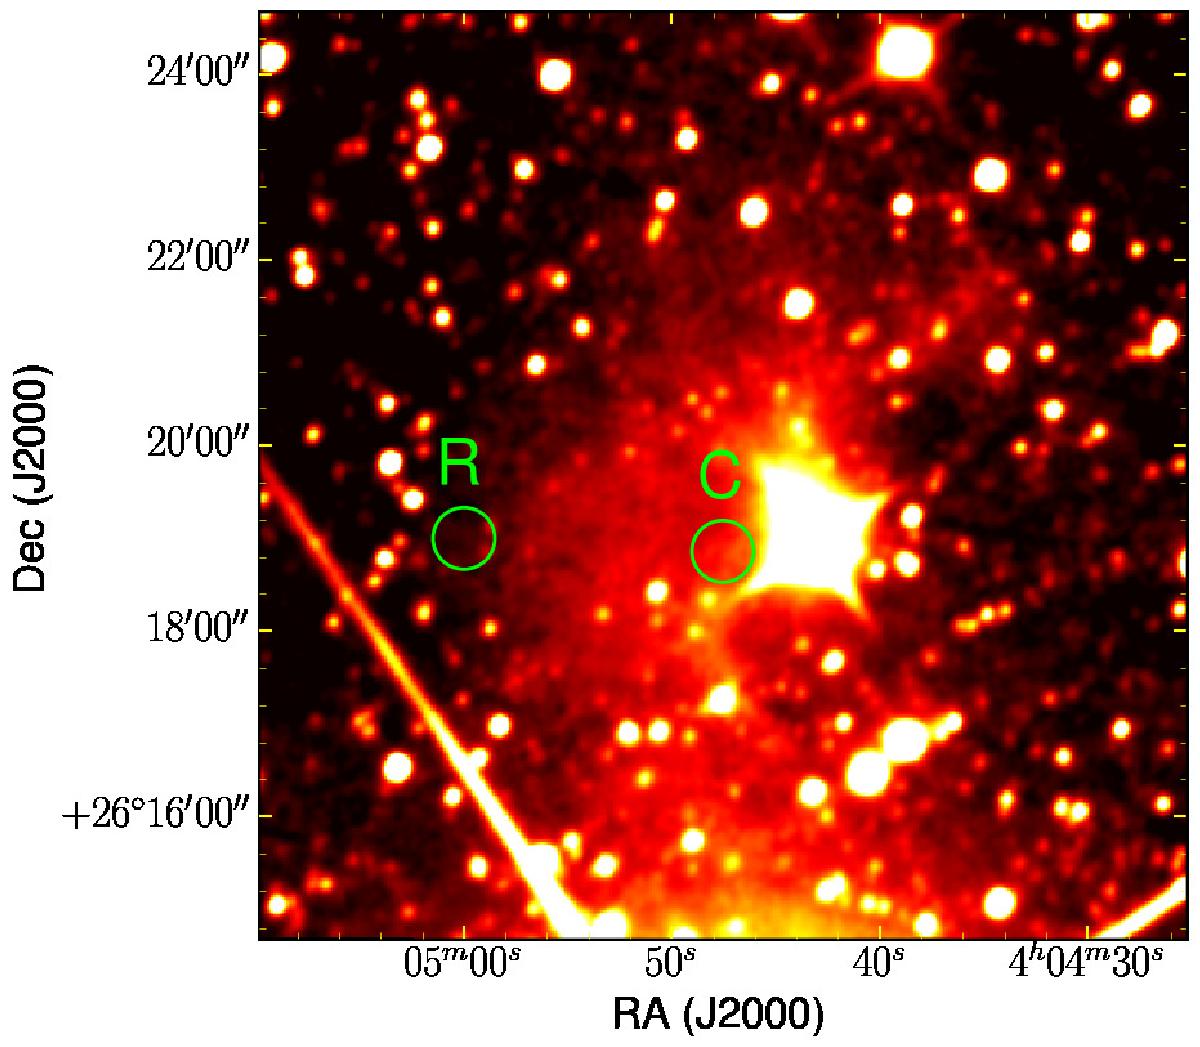
10′ × 10′ WISE W1 image of B207 at 3.4 μm. The protostar IRAS 04016+2610 is at the centre of the image. B207 is exhibiting the coreshine effect by showing a clear excess of 3.4 μm emission. The protostar IRAS 04016+2610 is at the centre of the image. B207 is exhibiting the coreshine effect by showing a clear excess of 3.4 μm. The coreshine effect is due to the scattering by large grains inside the globule. The two circular regions marked on the image are the core (C) and rim (R) regions, where we measured optical-, near-, mid-, and far-infrared intensities.
Current usage metrics show cumulative count of Article Views (full-text article views including HTML views, PDF and ePub downloads, according to the available data) and Abstracts Views on Vision4Press platform.
Data correspond to usage on the plateform after 2015. The current usage metrics is available 48-96 hours after online publication and is updated daily on week days.
Initial download of the metrics may take a while.