Fig. 9
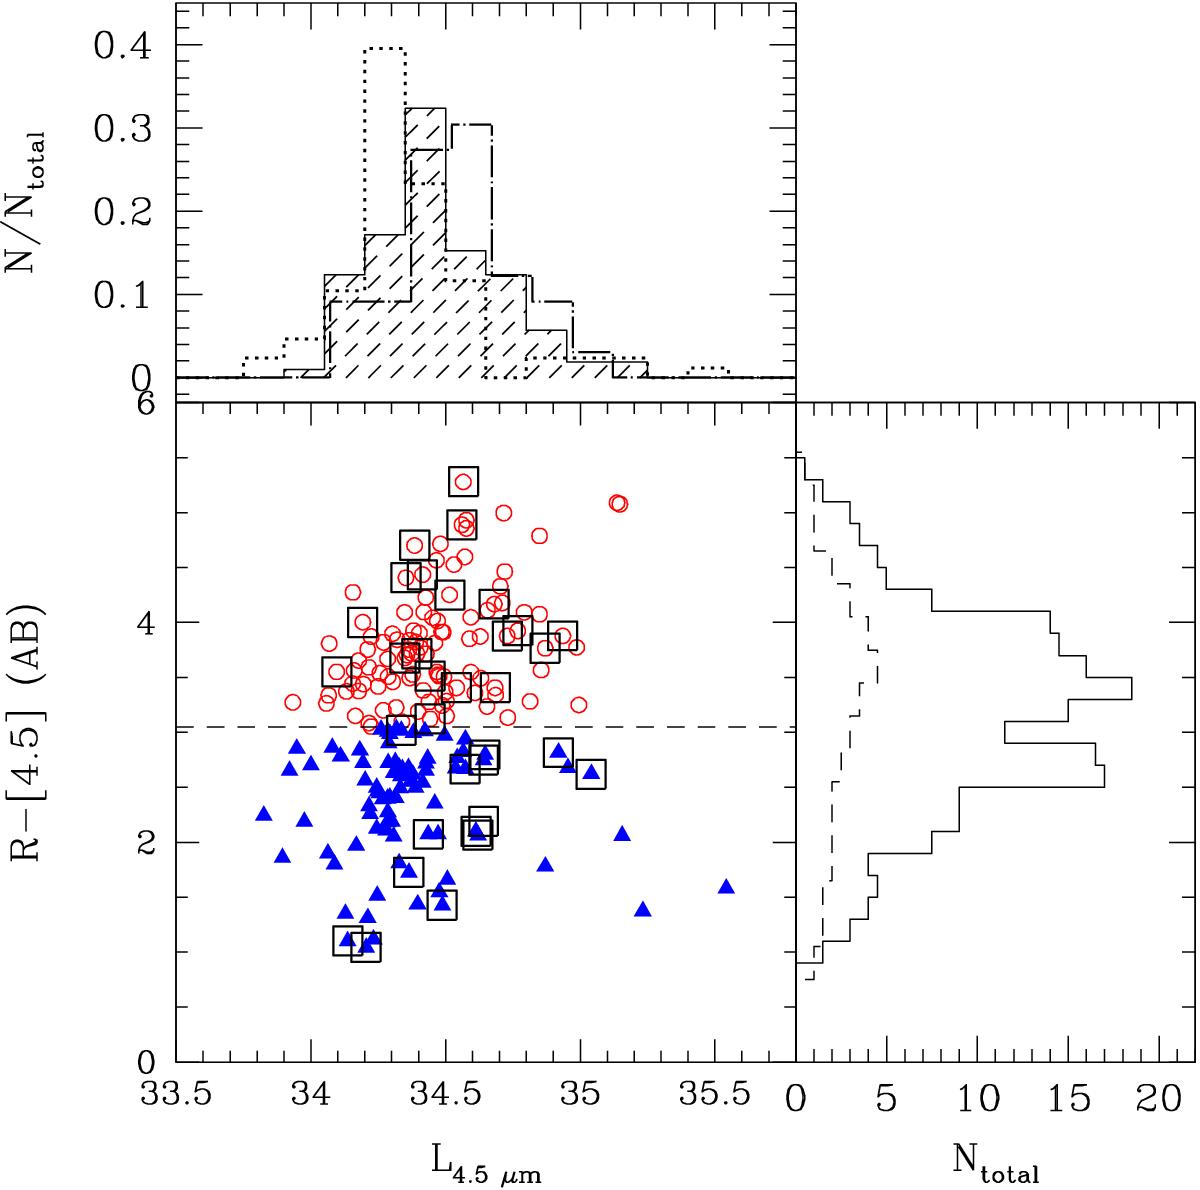
Optical-IR color, R− [4.5] vs. L4.5 μm. X-ray emitting AGNs are plotted with open squares. Top panel shows the corresponding distribution of MIR luminosity in the 4.5 μm for obscured (shade histogram), unobscured (dotted line) AGNs, and X-ray emitting AGNs (dot-long dash histogram). We introduce an artificial shift of 0.02 in the dot-long dash histogram for clarity. Right panel shows the color distribution of both AGN samples (solid line histogram) and the corresponding distribution considering AGN with X-ray emission (dash lines).
Current usage metrics show cumulative count of Article Views (full-text article views including HTML views, PDF and ePub downloads, according to the available data) and Abstracts Views on Vision4Press platform.
Data correspond to usage on the plateform after 2015. The current usage metrics is available 48-96 hours after online publication and is updated daily on week days.
Initial download of the metrics may take a while.