Fig. 15
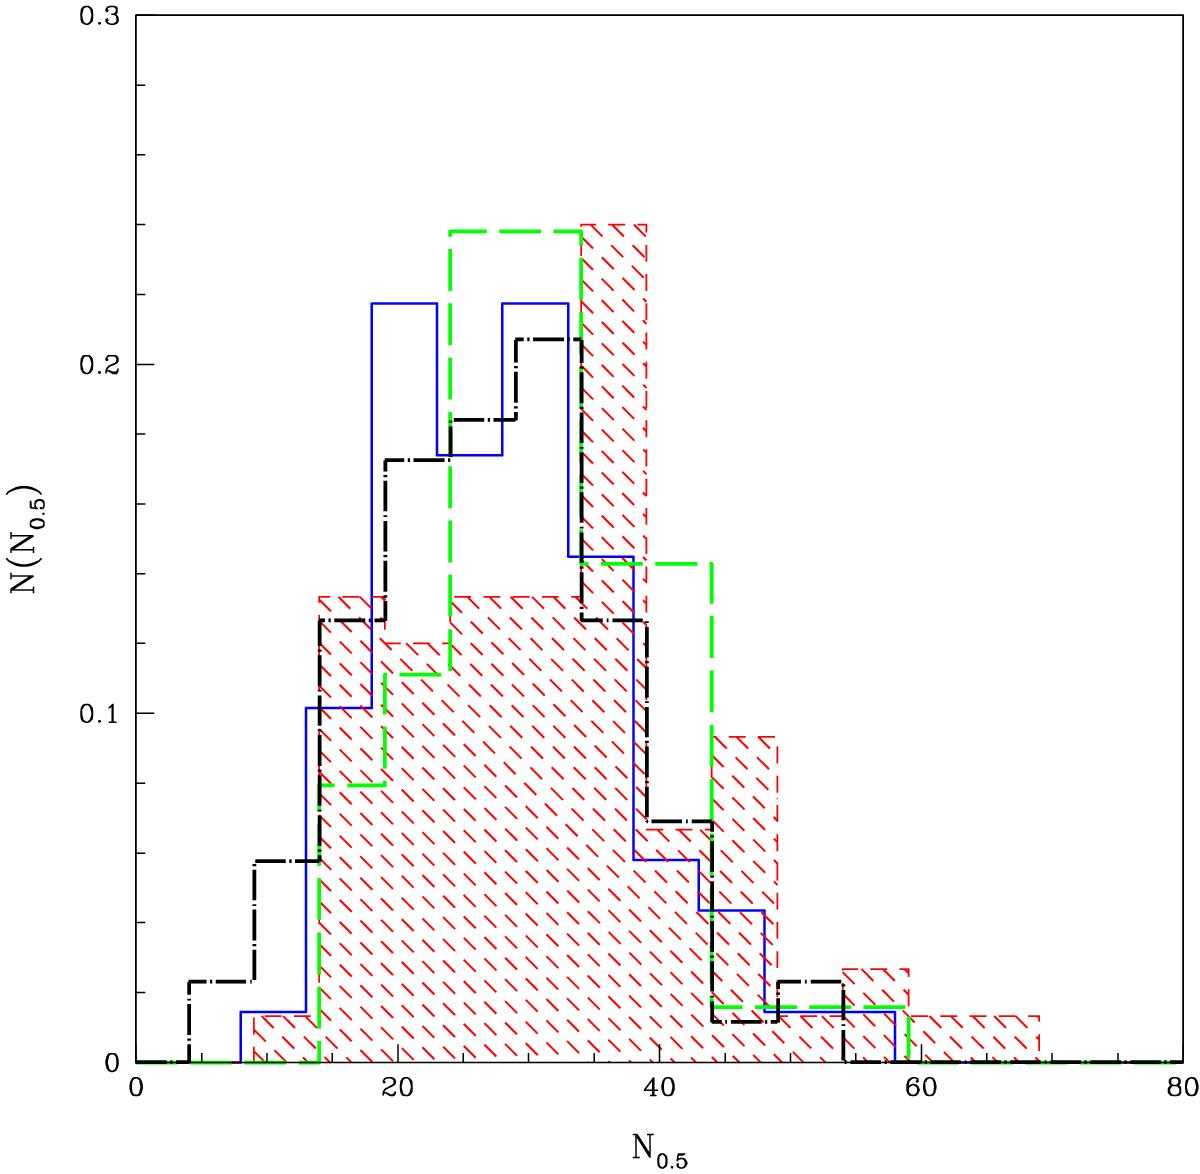
Projected density of galaxies within 0.5 Mpc and with | zAGN−zgalaxy | ≤ 0.2 from the obscured and unobscured AGN (shaded and solid line histograms, respectively). The dot-long dash line histogram shows the galaxy counts obtained in a control galaxy field. Long dash line histogram correspond to the distribution of galaxies in the field of Lyman-break galaxies with spectral type obtained from a star-burst galaxy. We introduce an artificial shift in the dot-long dash histogram for clarity.
Current usage metrics show cumulative count of Article Views (full-text article views including HTML views, PDF and ePub downloads, according to the available data) and Abstracts Views on Vision4Press platform.
Data correspond to usage on the plateform after 2015. The current usage metrics is available 48-96 hours after online publication and is updated daily on week days.
Initial download of the metrics may take a while.