Fig. 10
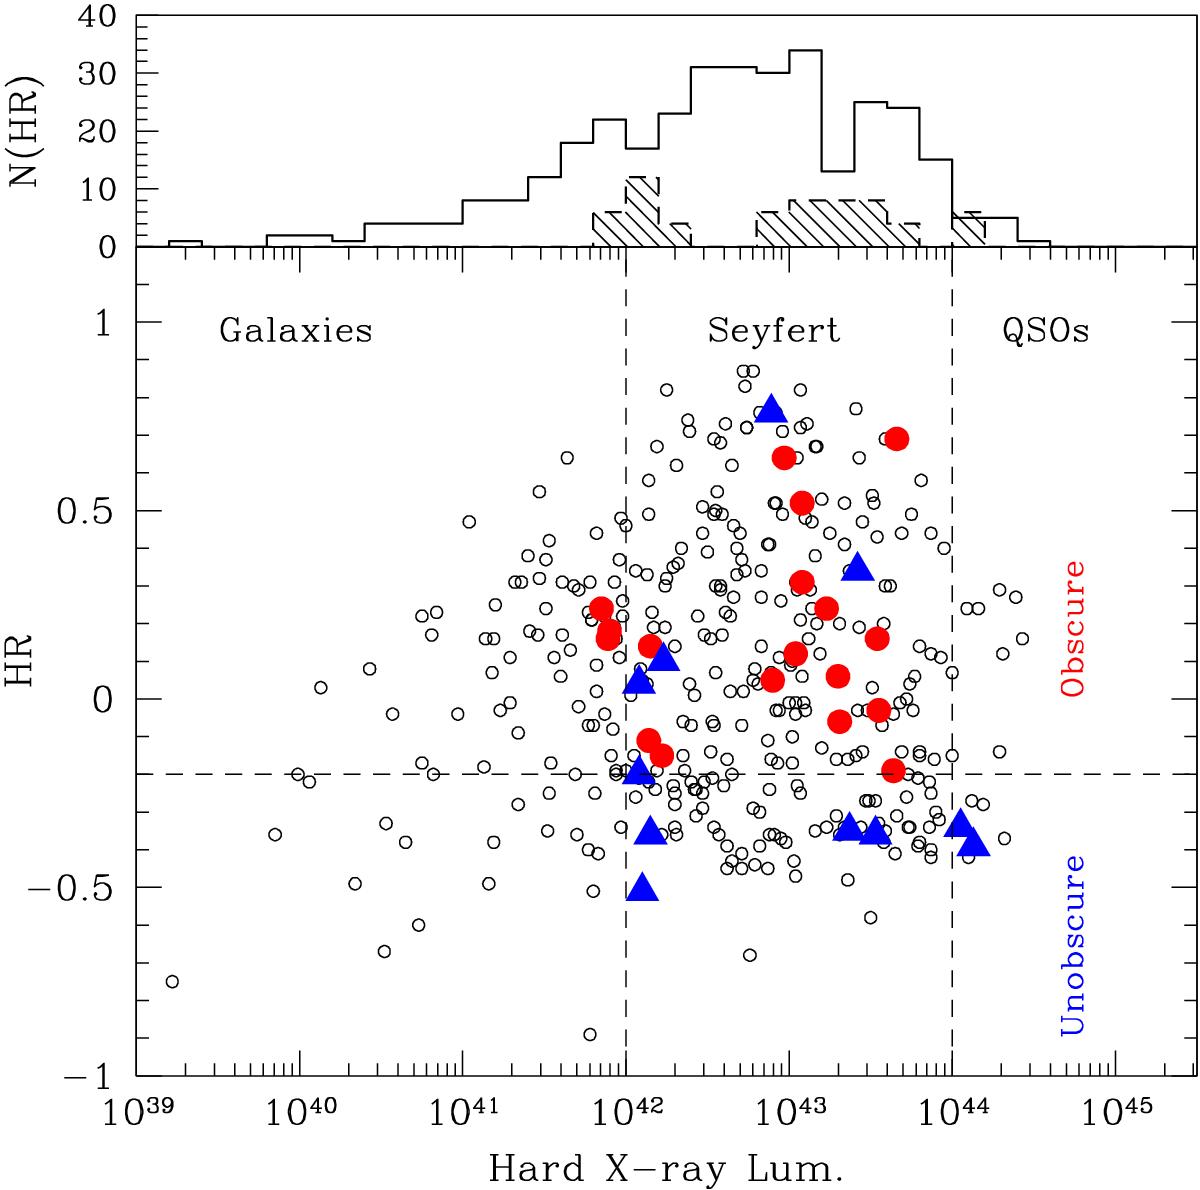
Hardness ratio as a function of hard X-ray luminosity for all MIR matches (open circles). Sources classified as obscured and unobscured sources are plotted with filled circles and triangles, respectively. Vertical dashed lines show the typical separation for normal galaxies, Seyfert-like galaxies and quasars used in the X-rays. The dashed horizontal line shows the HR value for a source with NH> 1021.6 cm2 at z> 1. In the upper panel we plot the hard X-ray luminosity distribution for all the sources (solid line histogram) and dashed histogram represent the corresponding distribution for MIR selected AGNs (obscured and unobscured samples). For a better comparison, the AGN hard X-ray luminosity (shade histogram) have been scaled up by a factor of two to show their relative values compared to the whole sample of X-ray source detections.
Current usage metrics show cumulative count of Article Views (full-text article views including HTML views, PDF and ePub downloads, according to the available data) and Abstracts Views on Vision4Press platform.
Data correspond to usage on the plateform after 2015. The current usage metrics is available 48-96 hours after online publication and is updated daily on week days.
Initial download of the metrics may take a while.