Fig. 3
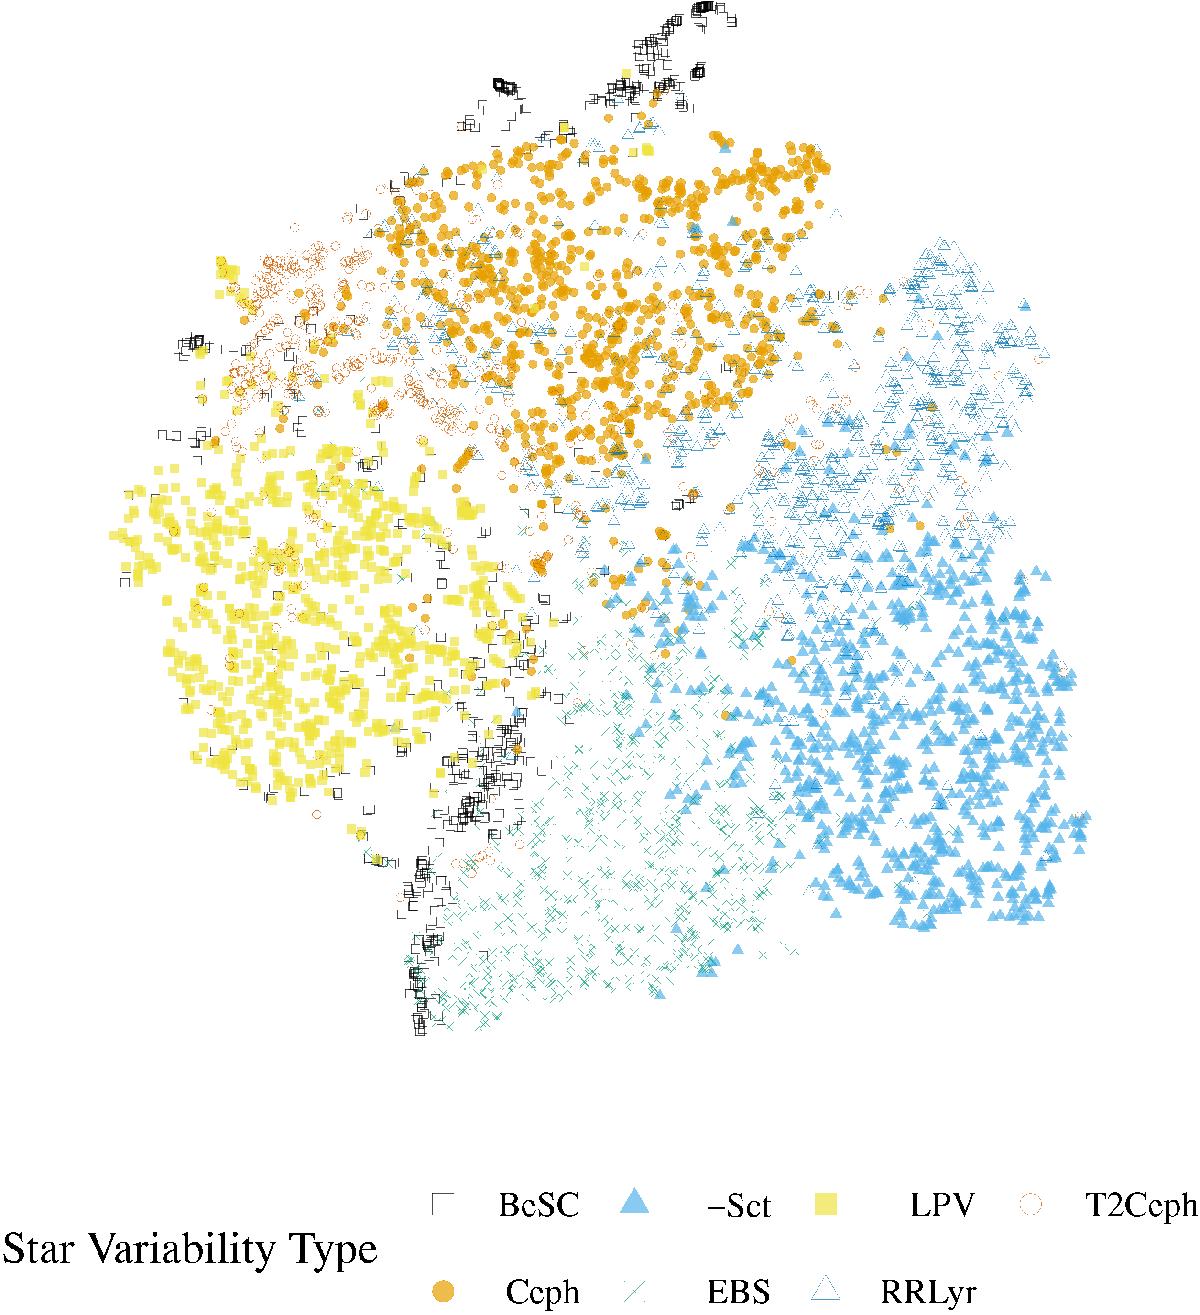
Visualisation of the six-dimensional feature space by t-SNE technique. The axes are omitted because the scale and orientation of this embedding carries no meaning. It can be seen how the different variability classes are separated in the six-dimensional feature space, although some overlapping of the classes is also evident.
Current usage metrics show cumulative count of Article Views (full-text article views including HTML views, PDF and ePub downloads, according to the available data) and Abstracts Views on Vision4Press platform.
Data correspond to usage on the plateform after 2015. The current usage metrics is available 48-96 hours after online publication and is updated daily on week days.
Initial download of the metrics may take a while.