Free Access
Fig. 2
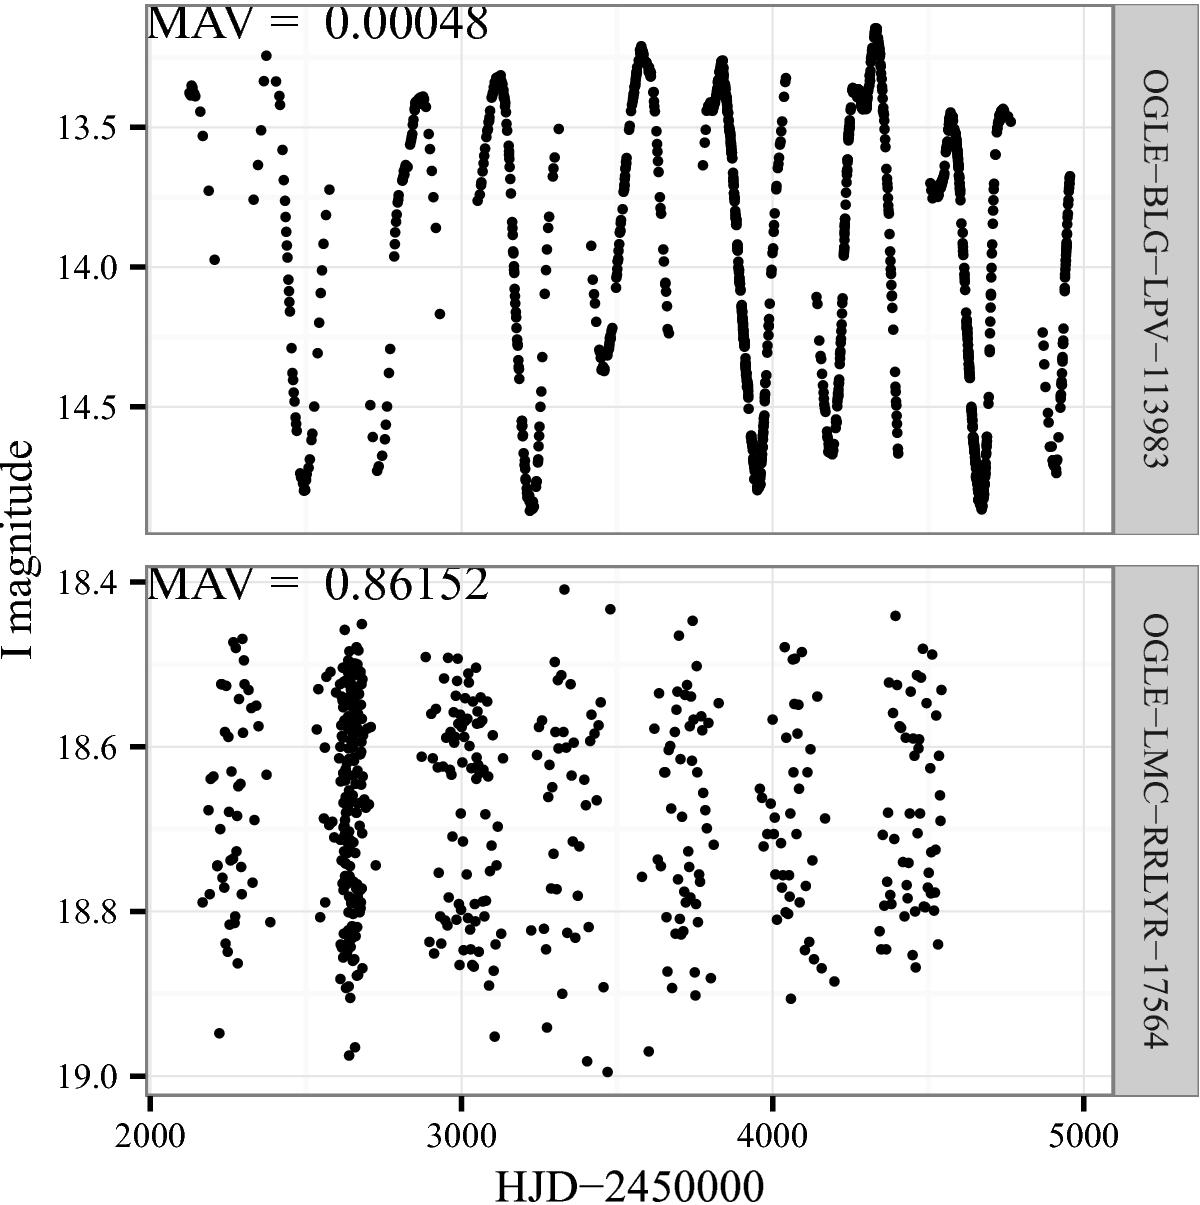
Time series of two variable stars from the OGLE-III catalogue. Upper panel shows LPV data with low MAV value, corresponding to curves that vary in the same timescale as the measurements. Bottom panel shows RR Lyr data with a higher MAV value that looks random before being folded.
Current usage metrics show cumulative count of Article Views (full-text article views including HTML views, PDF and ePub downloads, according to the available data) and Abstracts Views on Vision4Press platform.
Data correspond to usage on the plateform after 2015. The current usage metrics is available 48-96 hours after online publication and is updated daily on week days.
Initial download of the metrics may take a while.