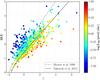
Fig. 5

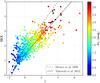
Left: IRX-β diagram of our sample (![]() cut applied on the free AV models), with the colorbar indicating the ratio between predicted and observed LIR’s. Also shown are the Meurer et al. (1999) relation (dashed) and its more recent revision by Takeuchi et al. (2012; solid). Surprisingly, although the sample is IR-selected, it shows a wide range of UV slopes, with an important number of sources appearing “too blue” for their LIR/LUV ratios. We can see that the sources for which the LIR is most underpredicted (blue in the colorbar), are found predominantly on the left of the diagram, meaning they have the bluest slopes. Right: same diagram, this time colored according to the extinction AV for the same model. Sources on the left of the Meurer relation tend to have less extinction than those at same IRX on the relation.
cut applied on the free AV models), with the colorbar indicating the ratio between predicted and observed LIR’s. Also shown are the Meurer et al. (1999) relation (dashed) and its more recent revision by Takeuchi et al. (2012; solid). Surprisingly, although the sample is IR-selected, it shows a wide range of UV slopes, with an important number of sources appearing “too blue” for their LIR/LUV ratios. We can see that the sources for which the LIR is most underpredicted (blue in the colorbar), are found predominantly on the left of the diagram, meaning they have the bluest slopes. Right: same diagram, this time colored according to the extinction AV for the same model. Sources on the left of the Meurer relation tend to have less extinction than those at same IRX on the relation.
Current usage metrics show cumulative count of Article Views (full-text article views including HTML views, PDF and ePub downloads, according to the available data) and Abstracts Views on Vision4Press platform.
Data correspond to usage on the plateform after 2015. The current usage metrics is available 48-96 hours after online publication and is updated daily on week days.
Initial download of the metrics may take a while.