Fig. 21
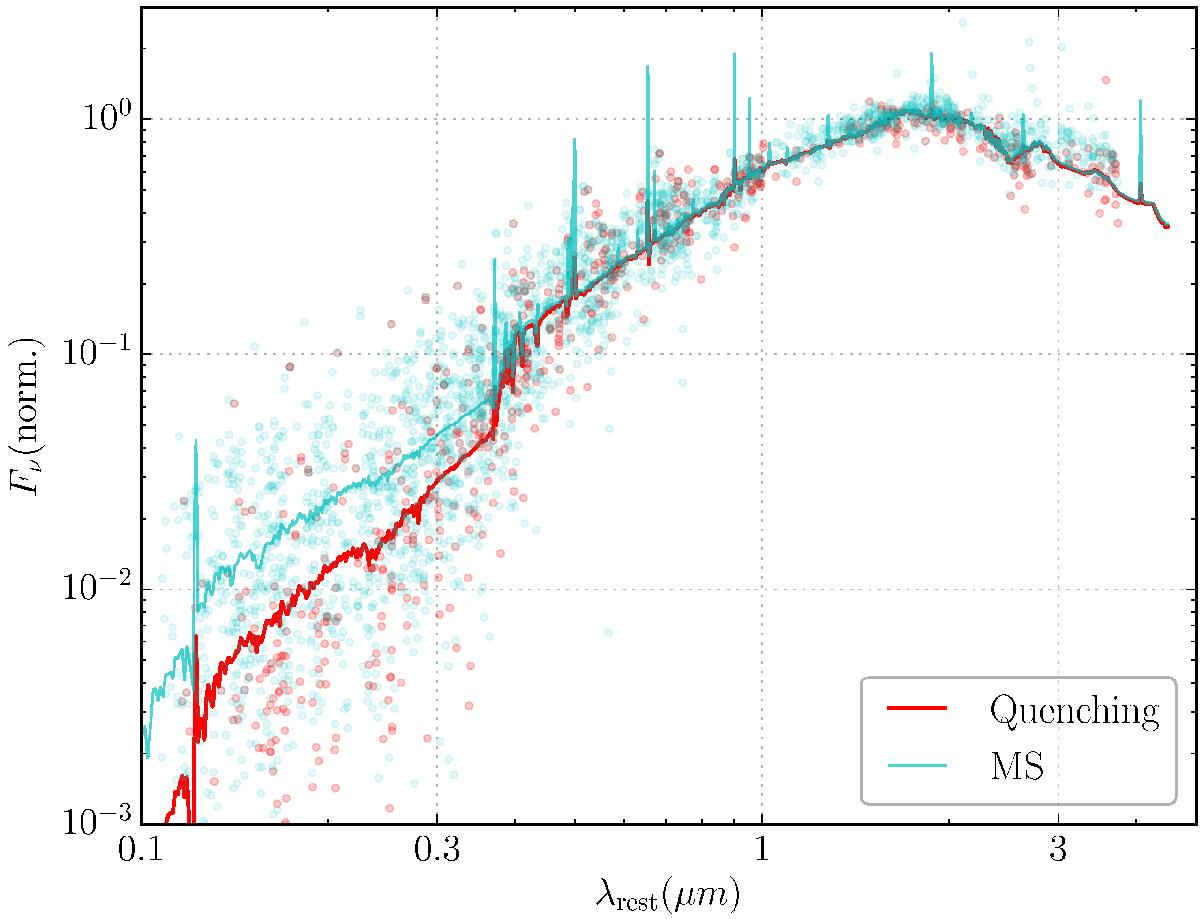
Mean SED of the quenching subsample found in the GOODS sample (red), compared to the mean SED of MS galaxies (cyan) at the same mass range, normalized and de-redshifted. We note the prominent Balmer break (≲0.4 μm), indicative of an aging population, and the weaker emission lines of the quenching SED. The average extinction is otherwise very similar.
Current usage metrics show cumulative count of Article Views (full-text article views including HTML views, PDF and ePub downloads, according to the available data) and Abstracts Views on Vision4Press platform.
Data correspond to usage on the plateform after 2015. The current usage metrics is available 48-96 hours after online publication and is updated daily on week days.
Initial download of the metrics may take a while.