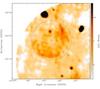
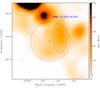
Fig. 4
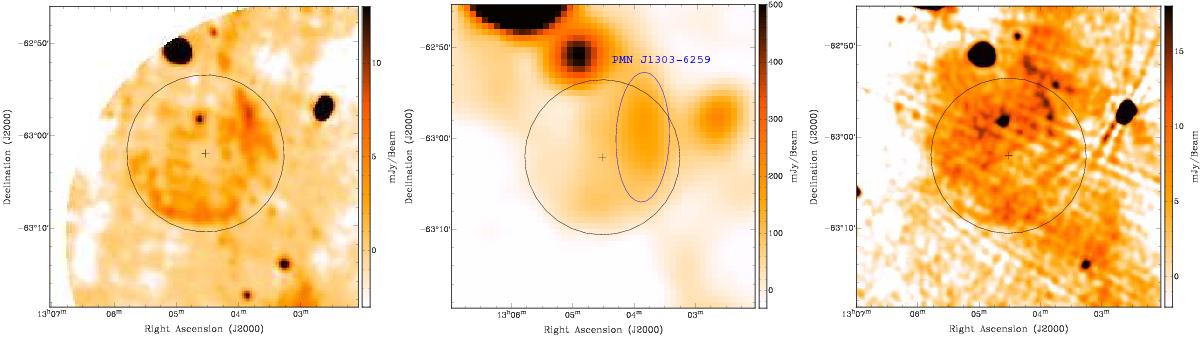
Left: radio map of the G304.4−0.2 region at 1.384 GHz. Middle: radio map of the G304.4−0.2 region at 4.85 GHz obtained in the PMN survey (Condon et al. 1993). The blue ellipse shows the extension of the PMN survey source PMN J1303−6259 as presented in the catalogue (Wright et al. 1994). The resolution of this map is ~ 5′ (Condon et al. 1993). Right: radio map of the G304.4−0.2 region at 843 MHz obtained in the MGPS-2 survey (Murphy et al. 2007). The size of the beam is ~ 45′′ × 50′′. The black circle in all the panels indicates the extension of the shell-like structure and the black cross shows its centre. Middle and right images were obtained using the NASA SkyView online tool (http://skyview.gsfc.nasa.gov).
Current usage metrics show cumulative count of Article Views (full-text article views including HTML views, PDF and ePub downloads, according to the available data) and Abstracts Views on Vision4Press platform.
Data correspond to usage on the plateform after 2015. The current usage metrics is available 48-96 hours after online publication and is updated daily on week days.
Initial download of the metrics may take a while.