Free Access
Fig. 3
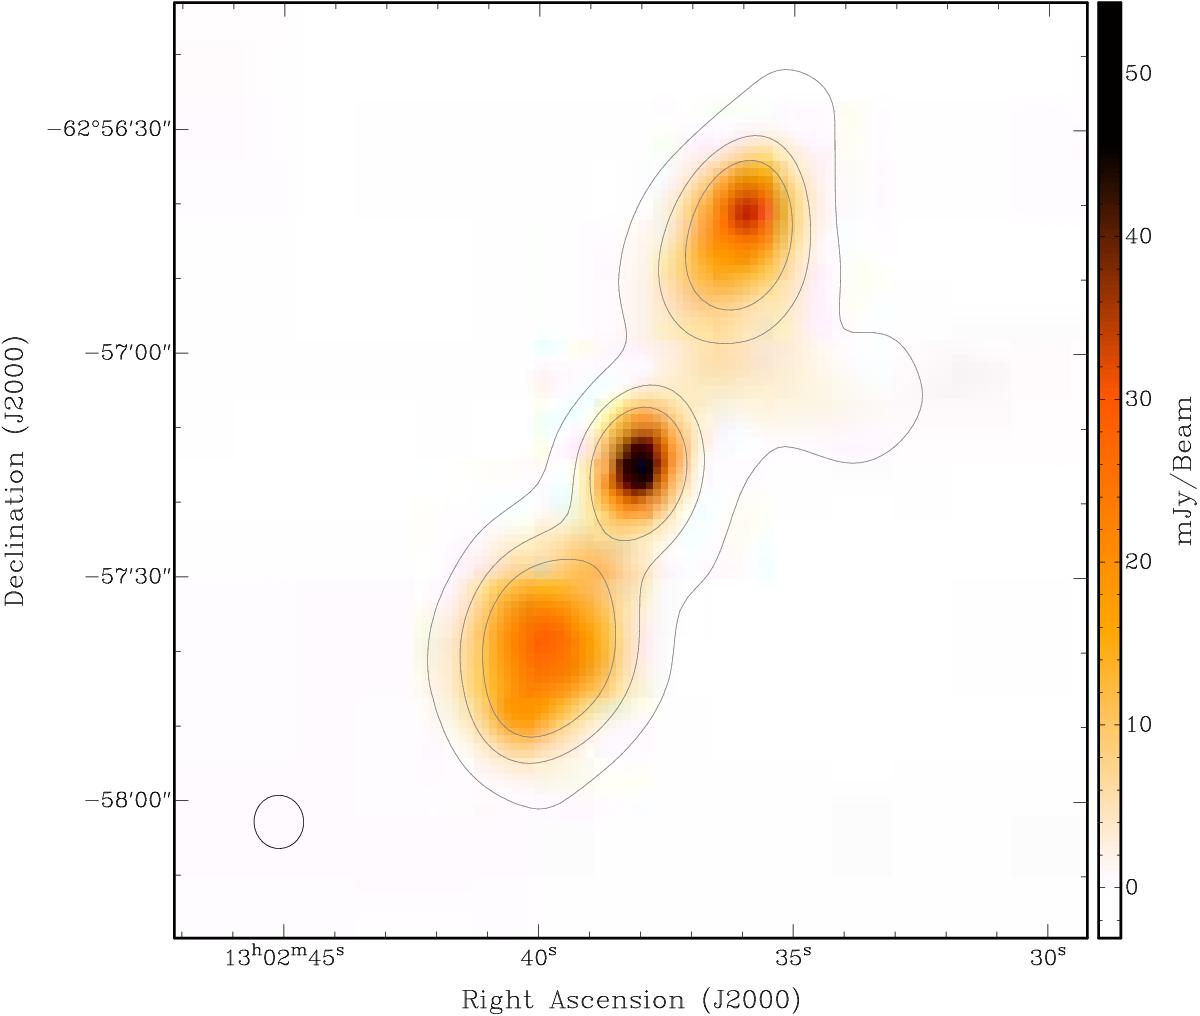
Radio map of MGPS J130237 − 625718 at 2.368 GHz overlaid with contours indicating the significance of the emission at 1.384 GHz at the level of 10, 40, and 80 times the rms noise. The synthesised beam is shown with a black ellipse in the bottom left corner.
Current usage metrics show cumulative count of Article Views (full-text article views including HTML views, PDF and ePub downloads, according to the available data) and Abstracts Views on Vision4Press platform.
Data correspond to usage on the plateform after 2015. The current usage metrics is available 48-96 hours after online publication and is updated daily on week days.
Initial download of the metrics may take a while.