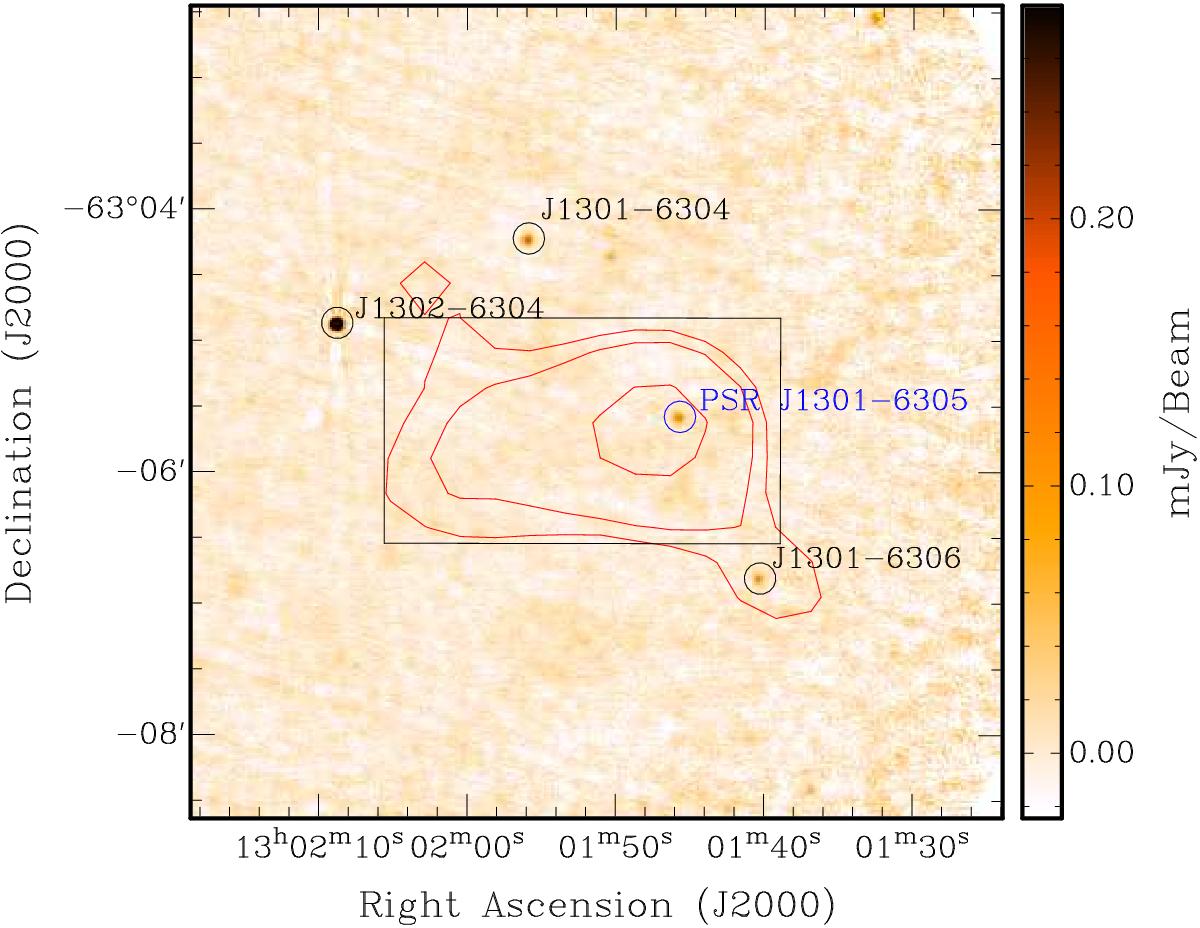
Fig. 1

Radio map of the HESS J1303−631 region at 5.5 GHz overlaid with contours of the X-ray PWN (red) as detected with XMM-Newton (Abramowski et al. 2012). X-ray contours show the peak of the emission close to the pulsar with a trail expanding in the eastern direction. The blue circle indicates the position of the pulsar PSR J1301−6305. The black box determines the region used for the flux density upper limit calculation. New point-like sources are indicated with index numbers. The synthesised beam is determined by an ellipse with the major and minor axes of 3.79′′ and 3.65′′, respectively, and the positional angle of − 7.6°.
Current usage metrics show cumulative count of Article Views (full-text article views including HTML views, PDF and ePub downloads, according to the available data) and Abstracts Views on Vision4Press platform.
Data correspond to usage on the plateform after 2015. The current usage metrics is available 48-96 hours after online publication and is updated daily on week days.
Initial download of the metrics may take a while.


