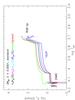
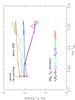
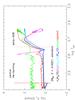
Fig. 3
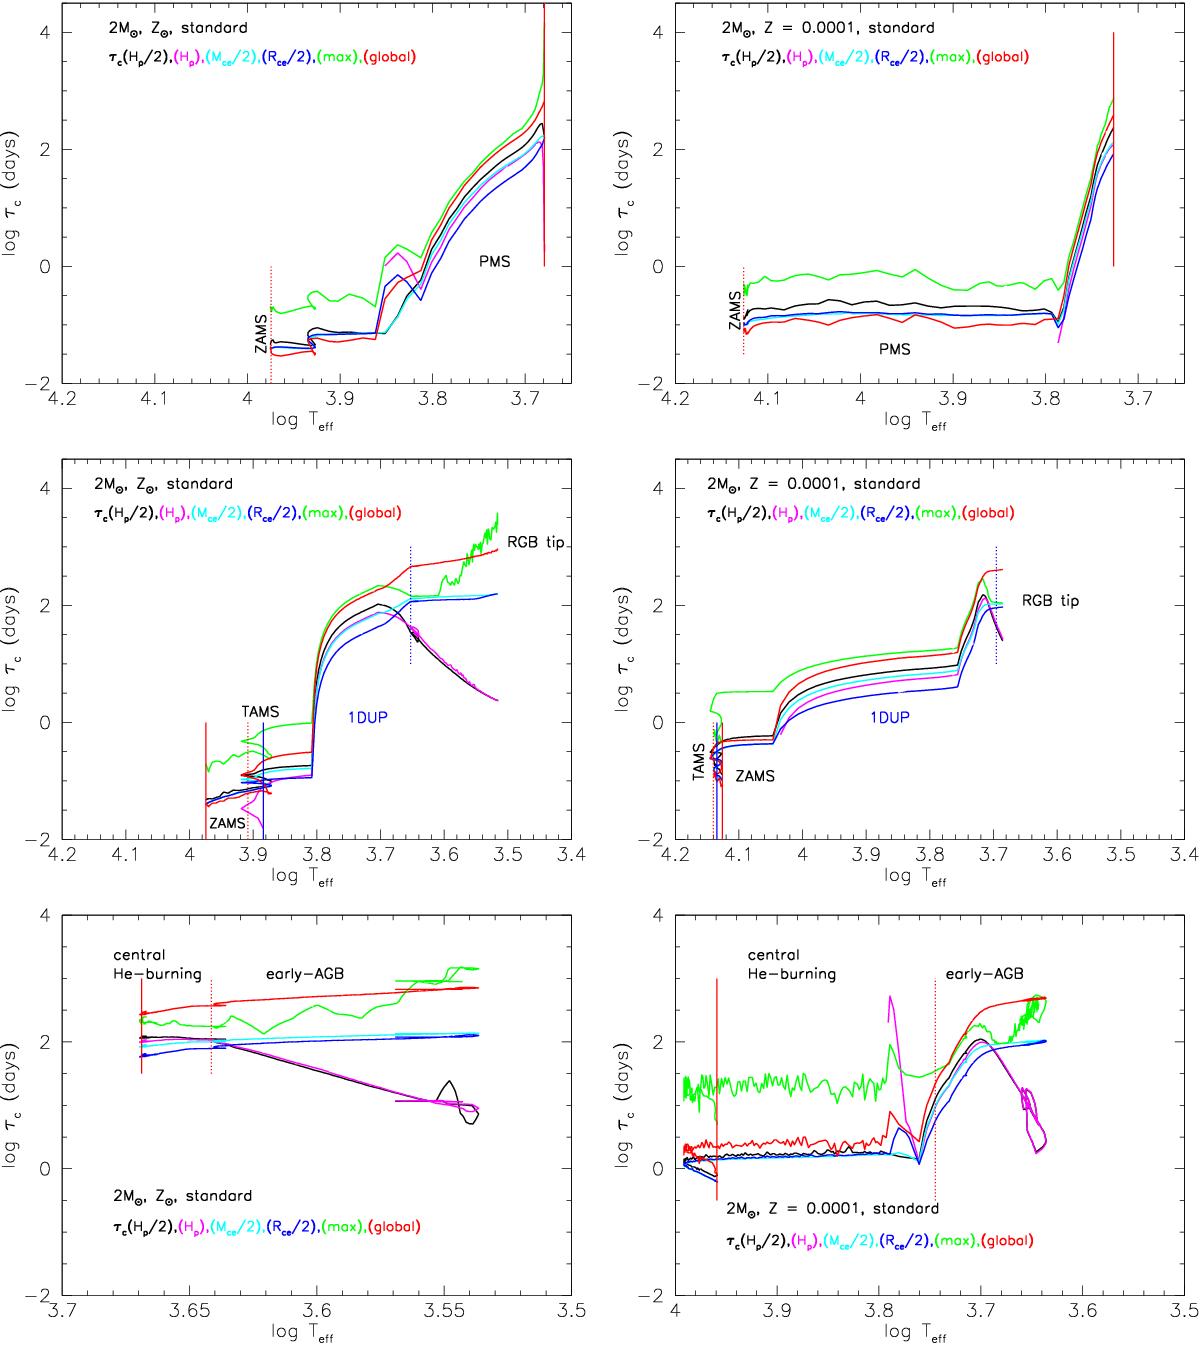
Evolution of the convective turnover time at different depths within the convective envelope as a function of effective temperature on the PMS (top), from the ZAMS up to the RGB tip (middle), and from the beginning of central helium-burning up to the end of the early-AGB (bottom). The vertical lines indicate the beginning and the end (solid and dashed, respectively) of the PMS, of the central H- and He-burning phases, and of the first dredge-up (in blue). Left and right figures correspond to the 2 M⊙ standard models computed at Z⊙ and Z = 0.0001 respectively. The magenta lines that are associated to τc(Hp) are sometimes interrupted; this corresponds to evolution phases when the radius at a pressure scale height Hp above the base of the convective envelope becomes larger than the radius of the star.
Current usage metrics show cumulative count of Article Views (full-text article views including HTML views, PDF and ePub downloads, according to the available data) and Abstracts Views on Vision4Press platform.
Data correspond to usage on the plateform after 2015. The current usage metrics is available 48-96 hours after online publication and is updated daily on week days.
Initial download of the metrics may take a while.