Fig. C.1
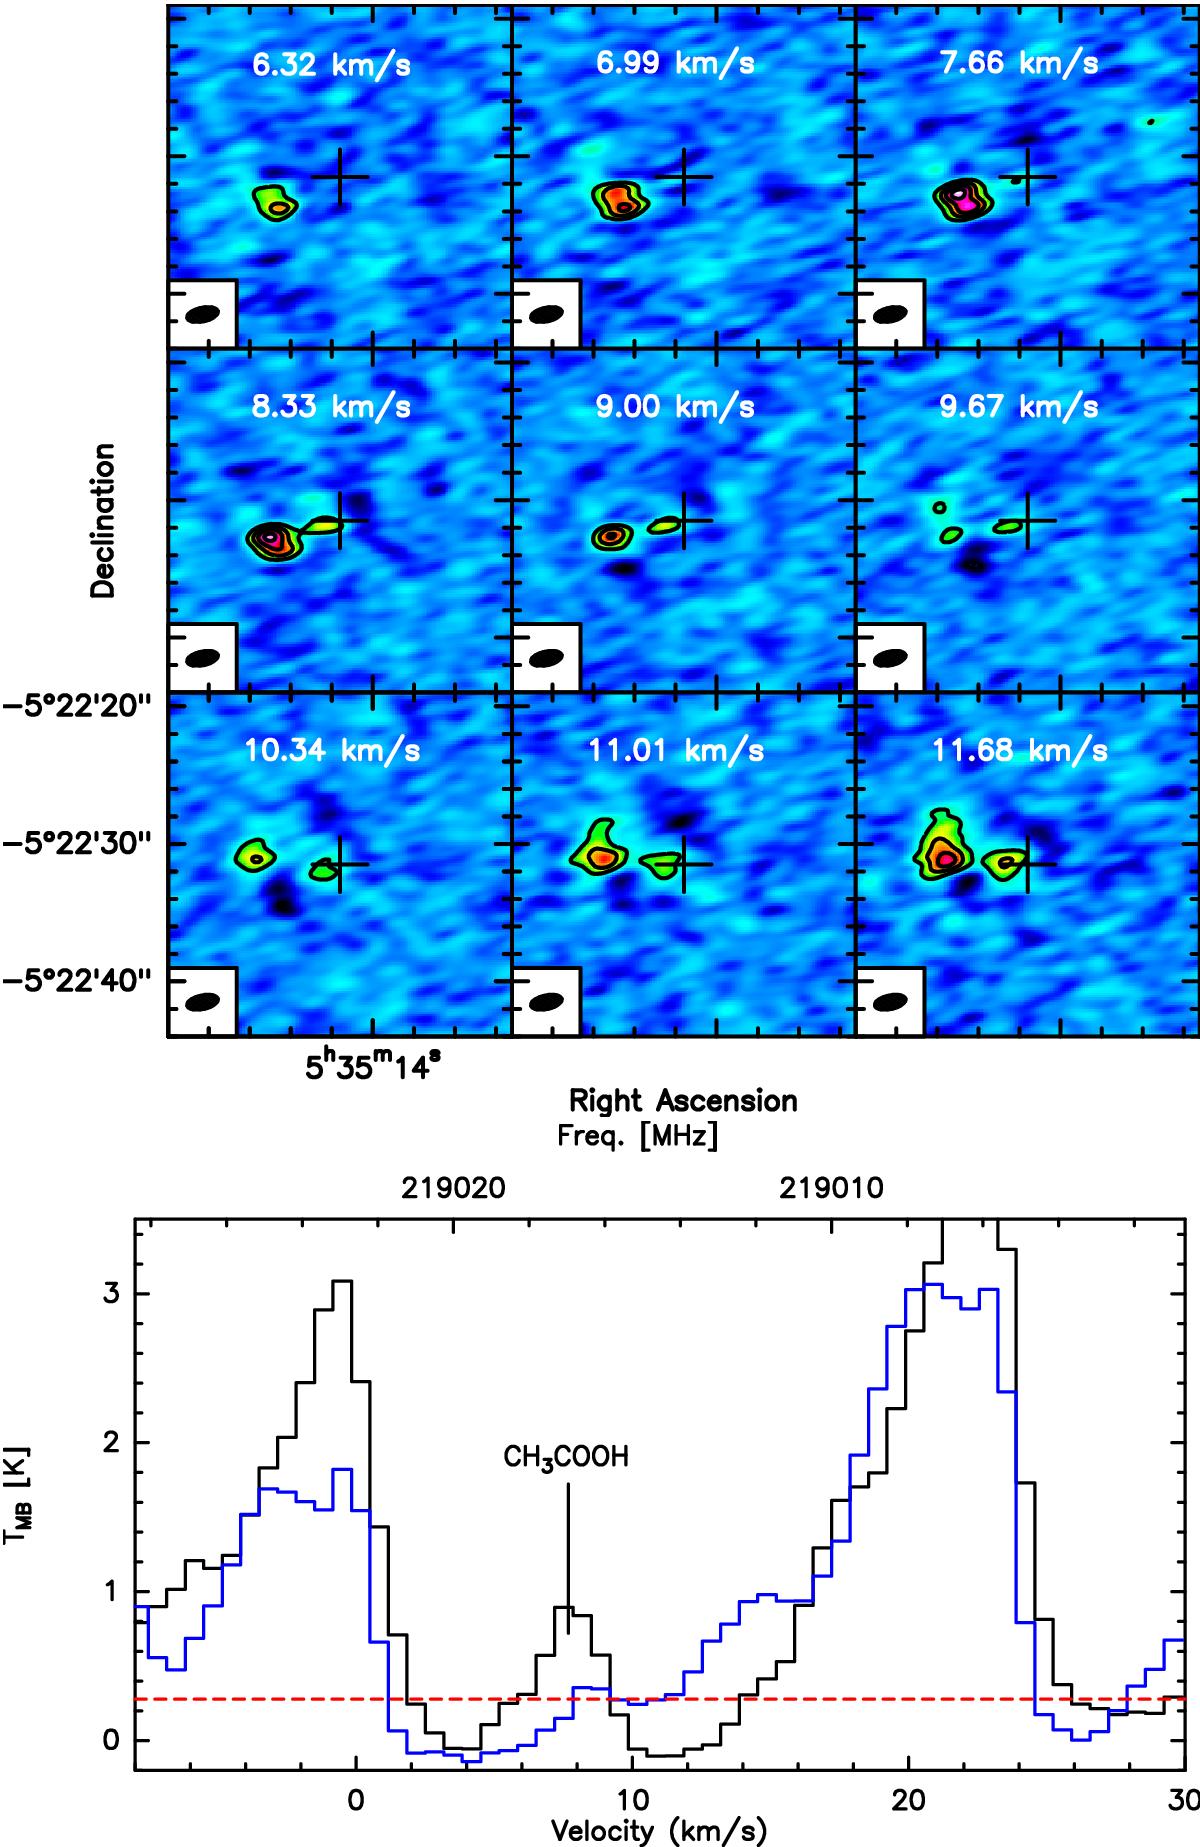
Top Panel: CH3COOH channel emission maps at 219 016 MHz. Bottom Panel: spectra centred at 219 016 MHz. The black spectrum is taken in direction of the EGP emission peak while the blue one is taken in direction of the northwest clump which contaminates the CH3COOH emission maps displayed here as well as in Fig. 1. The red dashed line shows the 3σ noise level of the spectrum taken in direction of the northwest clump.
Current usage metrics show cumulative count of Article Views (full-text article views including HTML views, PDF and ePub downloads, according to the available data) and Abstracts Views on Vision4Press platform.
Data correspond to usage on the plateform after 2015. The current usage metrics is available 48-96 hours after online publication and is updated daily on week days.
Initial download of the metrics may take a while.