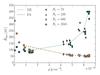
Fig. 2
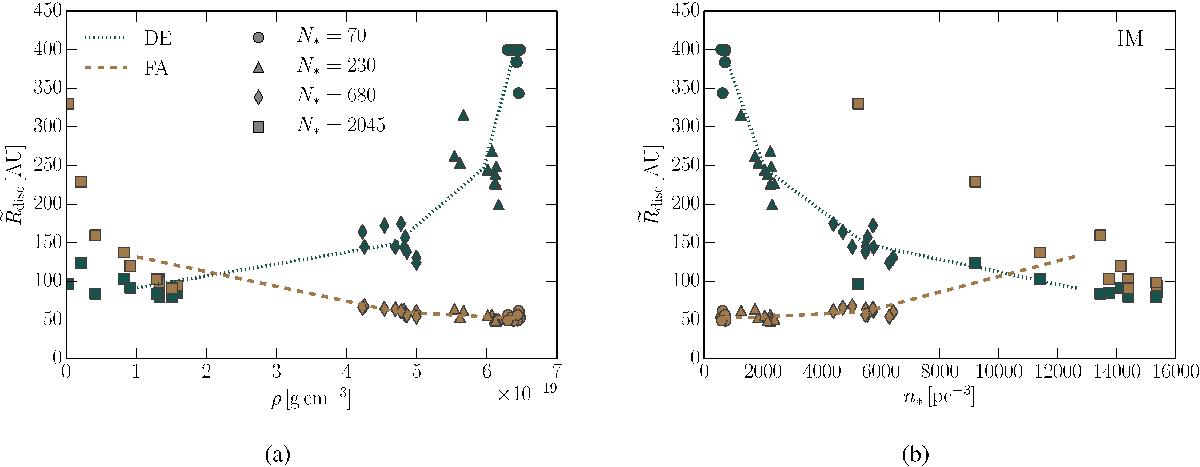
Panel a: median disc radius at the end of the simulation plotted against the average gas density within the cluster radius in the IM simulations. The colours and symbols correspond to the same process and number of stars as in Fig. 1. The lines connect the averages of the ten simulations with the same parameters. Panel b: same as in the left figure, but here we plot the median disc radius against the stellar density. The legend applies to both panels.
Current usage metrics show cumulative count of Article Views (full-text article views including HTML views, PDF and ePub downloads, according to the available data) and Abstracts Views on Vision4Press platform.
Data correspond to usage on the plateform after 2015. The current usage metrics is available 48-96 hours after online publication and is updated daily on week days.
Initial download of the metrics may take a while.