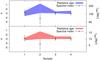
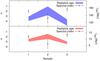
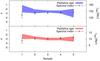
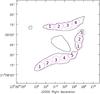
Fig. 5

Spectral index and radiative age trend along the radio arcs obtained with the sampling method shown in the bottom-right panel. On the x-axis is shown the sampling numeration (indicated in the bottom right panel), on the left y-axis the spectral index scale and on the right y-axis the radiative age scale. In each panel the top blue plot displays the radiative age estimated by assuming B = Bml = 2.1μG, and the bottom red plot displays the radiative age estimated by assuming the equipartition magnetic field B = Beq = 12μG. Top-left: northern arc trends; top-right: western arc trends; bottom-left: southern arc trends; bottom-right: sampling method. The black contours are the 1.4 GHz reference levels reported in Fig. 2, middle panel.
Current usage metrics show cumulative count of Article Views (full-text article views including HTML views, PDF and ePub downloads, according to the available data) and Abstracts Views on Vision4Press platform.
Data correspond to usage on the plateform after 2015. The current usage metrics is available 48-96 hours after online publication and is updated daily on week days.
Initial download of the metrics may take a while.