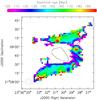
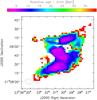
Fig. 4

Radiative age map (left) and relative error map (right) obtained from Fig. 3 by assuming B = 2.1μG and Γ = 2.4. The black contours are the same 1.4 GHz contours reported in Fig. 2, middle panel. The map displays the upper limit of the time required to steepen the spectral index of the synchrotron emission from − 0.7 to the value reported in Fig. 3.
Current usage metrics show cumulative count of Article Views (full-text article views including HTML views, PDF and ePub downloads, according to the available data) and Abstracts Views on Vision4Press platform.
Data correspond to usage on the plateform after 2015. The current usage metrics is available 48-96 hours after online publication and is updated daily on week days.
Initial download of the metrics may take a while.