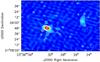
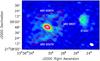
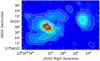
Fig. 2

Top panel: 3 GHz map (UNIFORM) at a resolution of 7′′.5 × 8′′.5 with rms noise = 40.1 μJy beam-1. Middle panel: 3 GHz map (ROBUST 0) at a resolution of 8′′.7 × 5′′.8, and rms noise = 20.4 μJy beam-1. Bottom panel: 3 GHz map (NATURAL, UVTAPER = [0,20]) at a resolution of 13′′.1 × 8′′.5, and rms noise = 18.5 μJy beam-1. In black there are the polarization vectors. In all panels the white contour levels are –3, 3, 6, 12, 24 × rms noise in all maps, the red ones are the 7, 14 × rms of 1.4 GHz maps made with comparable resolution.The rms levels of the red contours are 21.9 μJy beam-1.
Current usage metrics show cumulative count of Article Views (full-text article views including HTML views, PDF and ePub downloads, according to the available data) and Abstracts Views on Vision4Press platform.
Data correspond to usage on the plateform after 2015. The current usage metrics is available 48-96 hours after online publication and is updated daily on week days.
Initial download of the metrics may take a while.