Free Access
Fig. 3
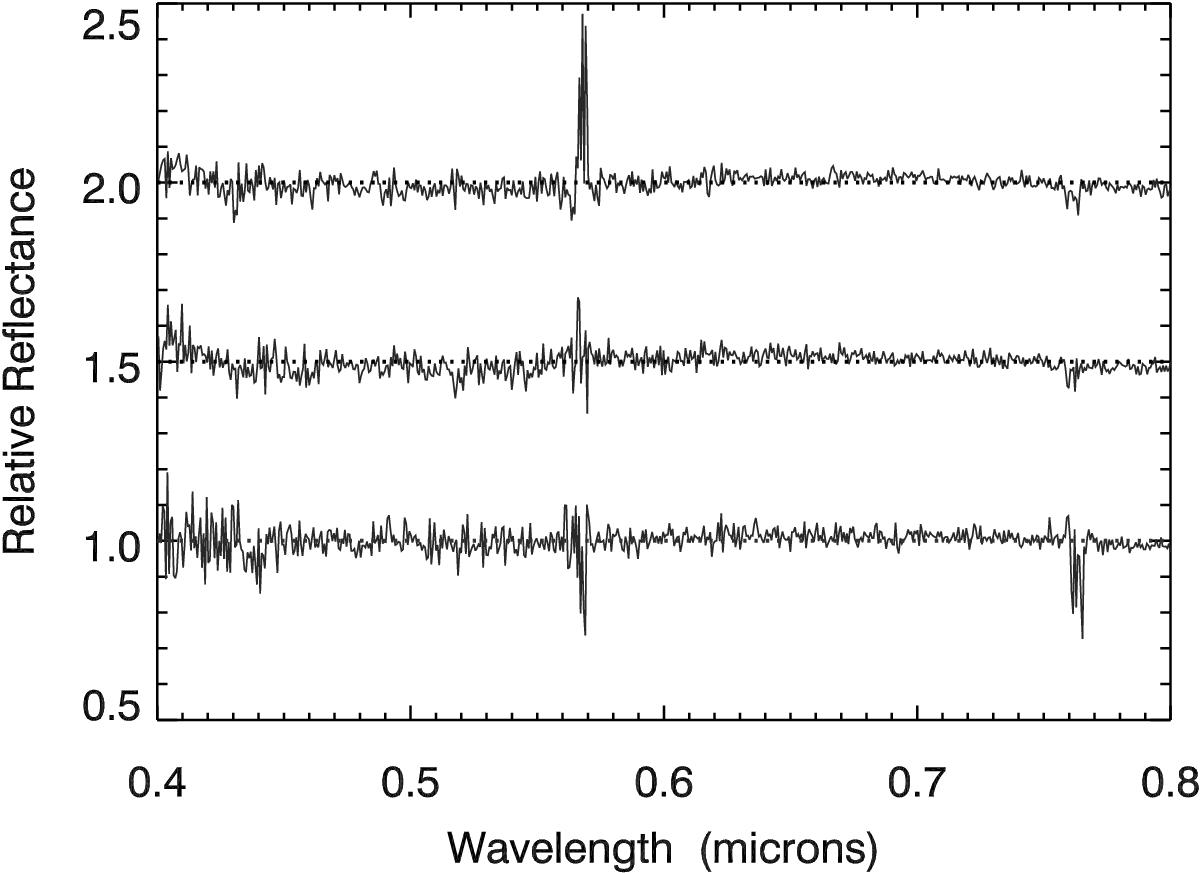
Three reflectance spectra of Huya in the visible, all corrected to their spectral slope and all normalized at 0.55 μm. Spectra have been shifted by 0, 0.5 and 1 unit, for clarity. Spectra appear chronologically from bottom to the top. In each case, the horizontal dot-line represents the normalized reflectance value.
Current usage metrics show cumulative count of Article Views (full-text article views including HTML views, PDF and ePub downloads, according to the available data) and Abstracts Views on Vision4Press platform.
Data correspond to usage on the plateform after 2015. The current usage metrics is available 48-96 hours after online publication and is updated daily on week days.
Initial download of the metrics may take a while.