Fig. 3
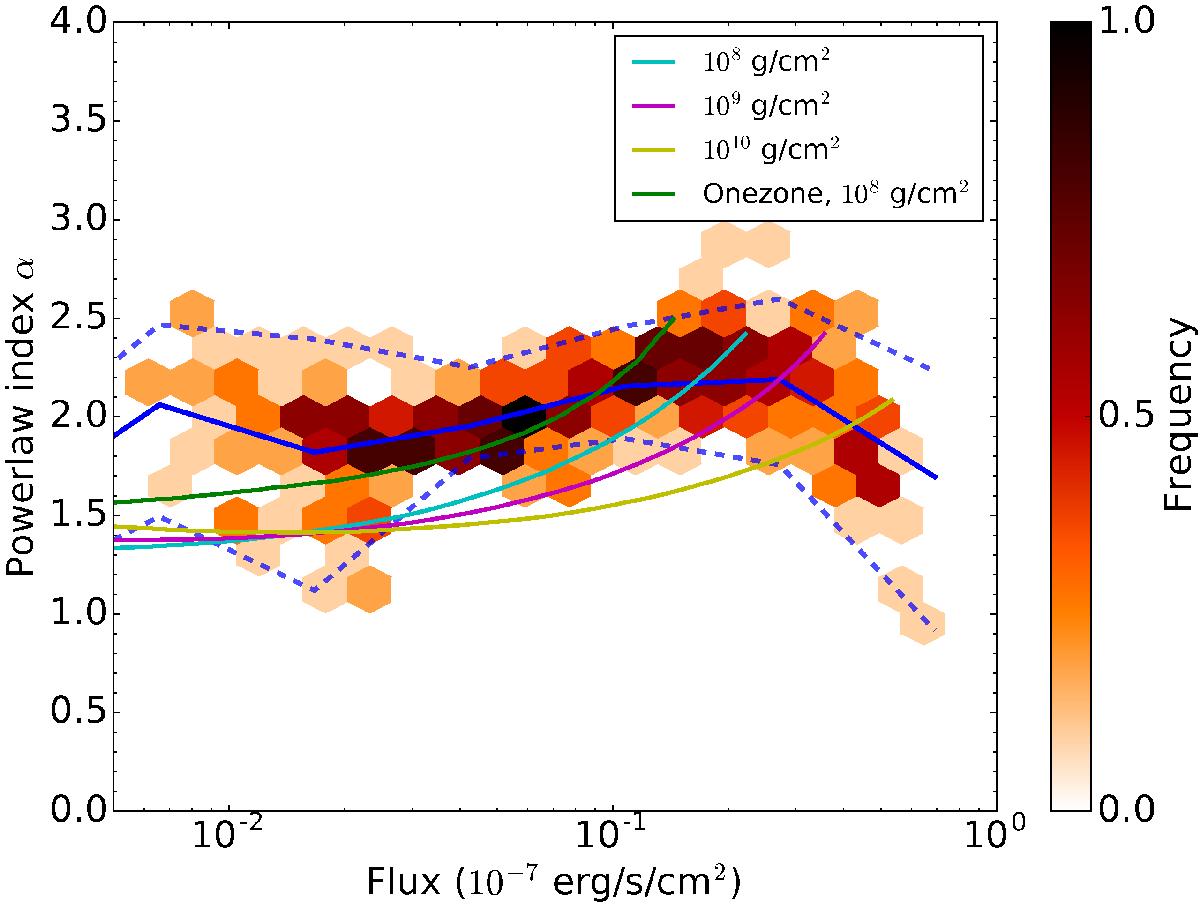
Dependence of the power-law index α on the burst flux for all bursts from 3A 1820–303 (all of these bursts are hard-state PRE bursts). The data are shown in a two-dimensional histogram, where the colour of a bin shows the frequency of occurrences (normalised to the peak value) according to the colour bar on the right. The solid blue line is the average of the data and the blue dashed lines show the 1σ limits. The solid green line shows the one-zone model with a column depth of 108 g cm-2, and the cyan, magenta, and yellow lines show the three multi-zone models with ignition depths of 108, 109, and 1010 g cm-2, respectively, based on the work of Cumming & Macbeth (2004).
Current usage metrics show cumulative count of Article Views (full-text article views including HTML views, PDF and ePub downloads, according to the available data) and Abstracts Views on Vision4Press platform.
Data correspond to usage on the plateform after 2015. The current usage metrics is available 48-96 hours after online publication and is updated daily on week days.
Initial download of the metrics may take a while.