Fig. 2
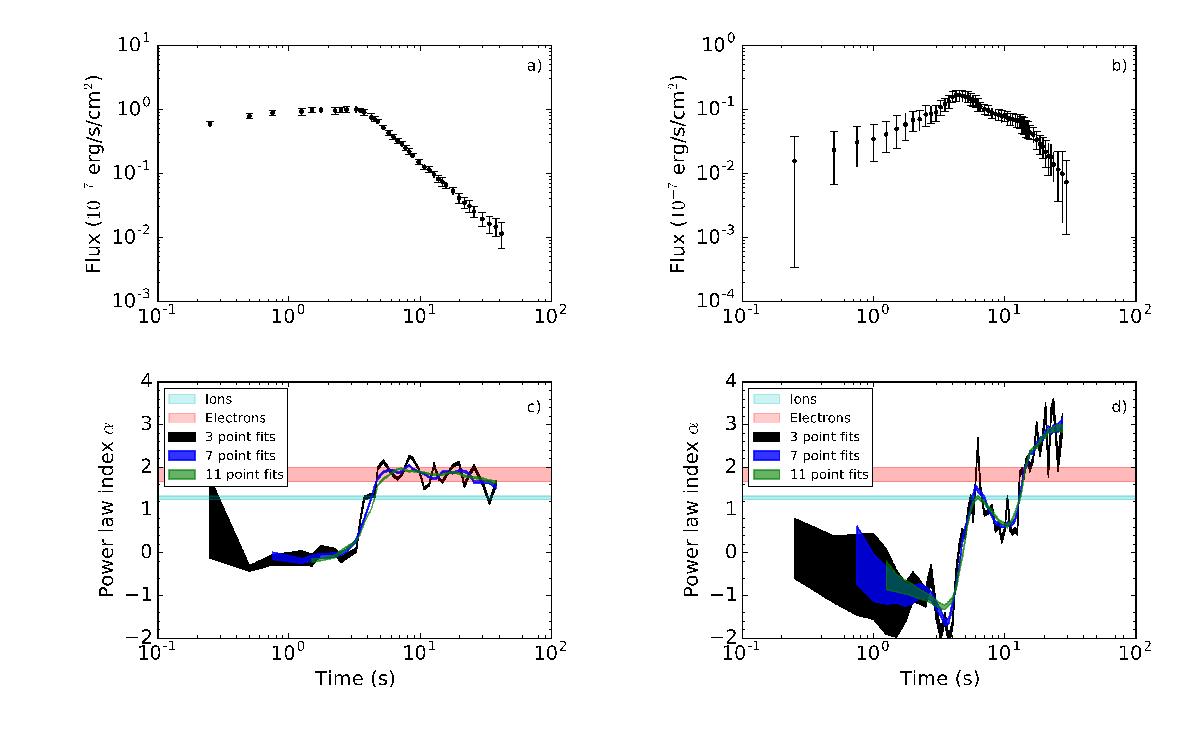
Two examples of application of the dynamic power-law index method to the bursts. The upper panels show the temporal evolution of the flux, while the lower panels give power-law indices. Left panels: aPRE burst from 4U 1728–34 (MJD 51 238.79155), which shows a nearly power-law dependence of flux on time; the power-law index α varies smoothly (panel c)). Right panels: a non-PRE burst from 4U 1636–536 (MJD 52 290.14847), whose temporal evolution does not follow a power law with the corresponding power-law index shown in panel d). In the lower panels the black, blue, and green areas represent the 1σ confidence levels of the power-law indices of the individual 3, 7, and 11 point fits, respectively. The power-law indices are shown for the entire burst, but we study only the cooling tails. Also in the lower panels the red area shows the typical α-regime if the cooling is dominated by electrons, and the cyan area corresponds to ion-dominated cooling (see text).
Current usage metrics show cumulative count of Article Views (full-text article views including HTML views, PDF and ePub downloads, according to the available data) and Abstracts Views on Vision4Press platform.
Data correspond to usage on the plateform after 2015. The current usage metrics is available 48-96 hours after online publication and is updated daily on week days.
Initial download of the metrics may take a while.