Fig. 1
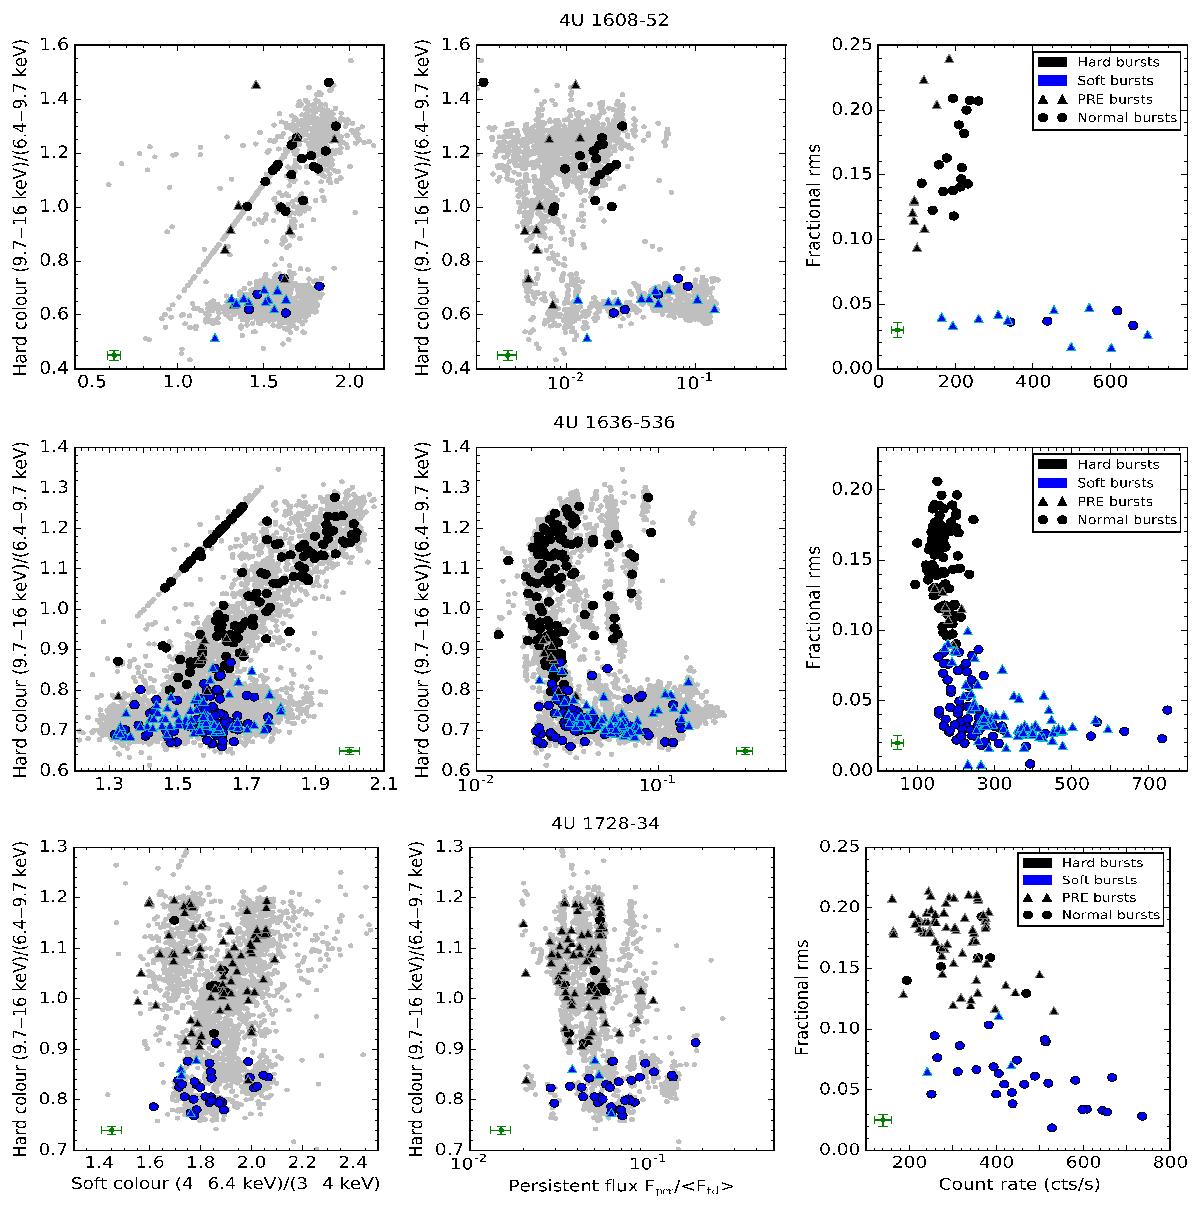
State separation for 4U 1636–536, 4U 1608–52, and 4U 1728–34. The left side panels are the colour-colour diagrams from Kajava et al. (2014) with the soft and hard state bursts indicated with blue and black markers, and PRE bursts and normal bursts marked with triangles and circles, respectively. The diagonal lines in the left panels are due to our energy band selection and the fact that the persistent emission can sometimes be described with a power law (see Kajava et al. 2014, for details). In the middle panels, the persistent flux normalised with the average touchdown flux is on the x-axis and the hard colour is on the y-axis (see Kajava et al. 2014). The right-hand panels show the dependence of the rms on the count rate used to separate the bursts into two states, as explained in Sect. 2.2 (see also Muñoz-Darias et al. 2014). The green crosses in the bottom of each panel show the typical error bars.
Current usage metrics show cumulative count of Article Views (full-text article views including HTML views, PDF and ePub downloads, according to the available data) and Abstracts Views on Vision4Press platform.
Data correspond to usage on the plateform after 2015. The current usage metrics is available 48-96 hours after online publication and is updated daily on week days.
Initial download of the metrics may take a while.