Fig. 9
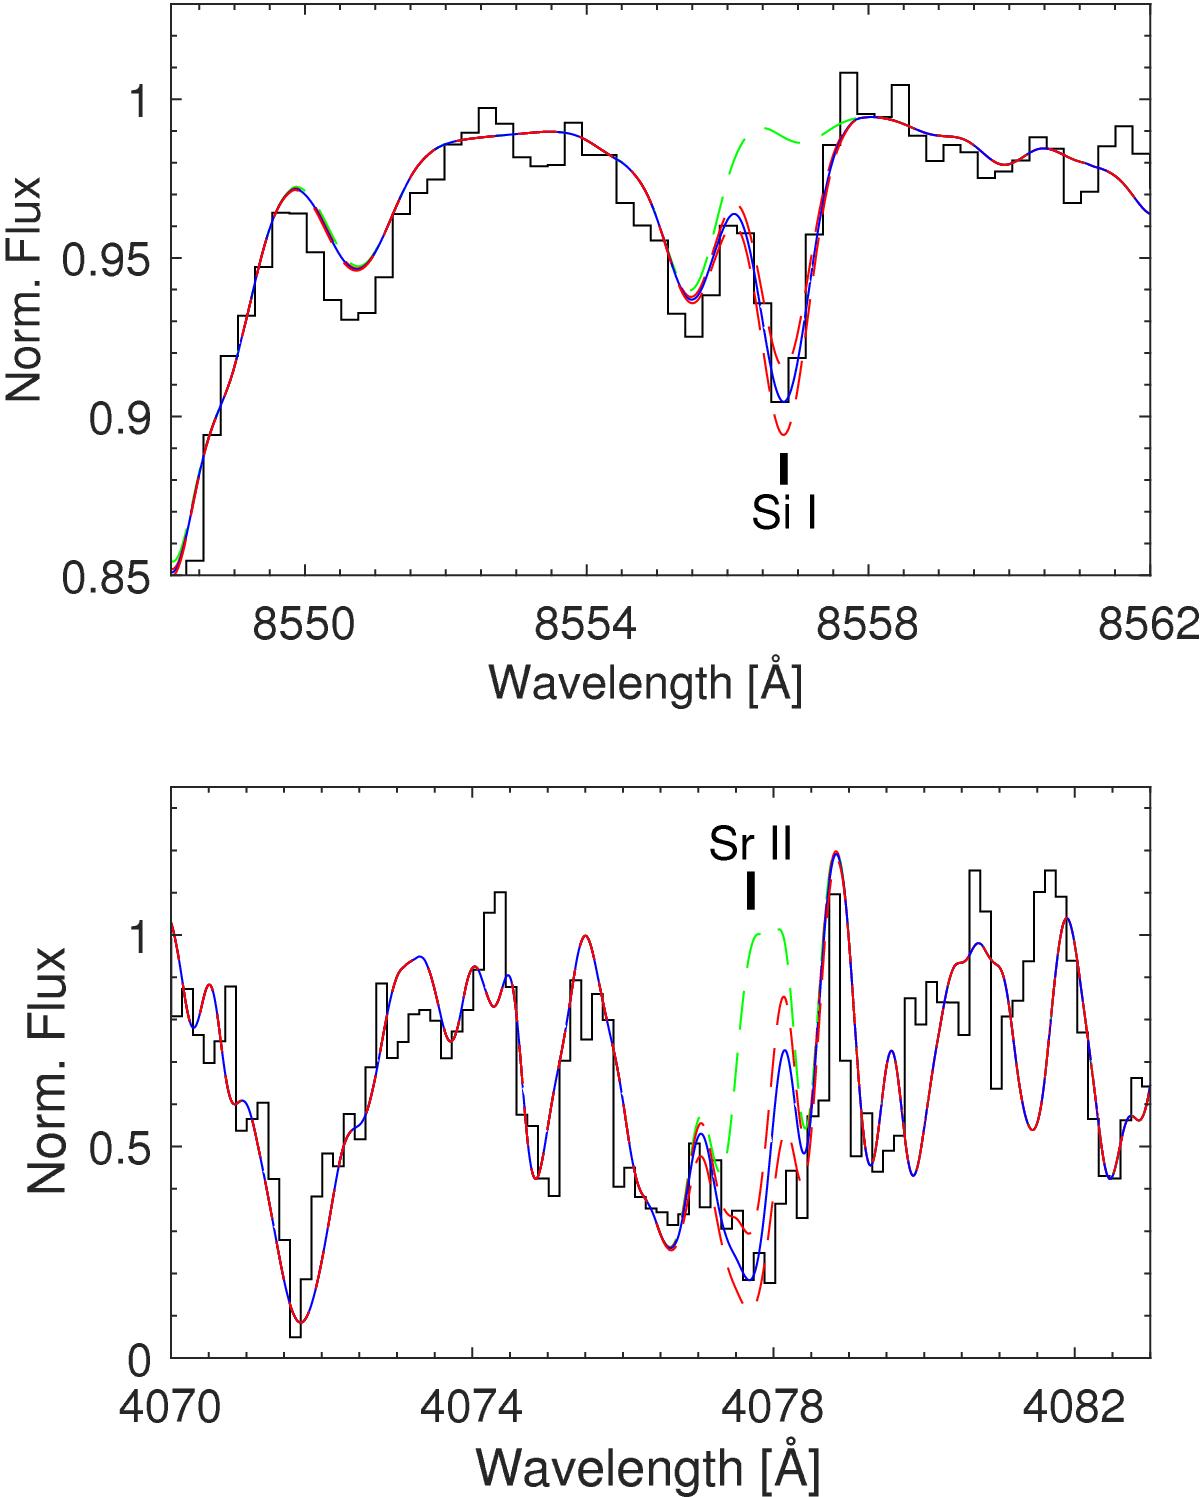
Synthetic spectra around the Si 8556 Å-line (top) and the Sr 4077 Å-line (bottom panel) in star 204 (black histograms). The blue lines have been computed with the best-fit abundances of [Si/Fe] = 0.44 and [Sr/Fe] = 0.00 dex, accounting for errors of ±0.2 dex (red). The green lines show syntheses without any Si and Sr, respectively.
Current usage metrics show cumulative count of Article Views (full-text article views including HTML views, PDF and ePub downloads, according to the available data) and Abstracts Views on Vision4Press platform.
Data correspond to usage on the plateform after 2015. The current usage metrics is available 48-96 hours after online publication and is updated daily on week days.
Initial download of the metrics may take a while.