Fig. 7
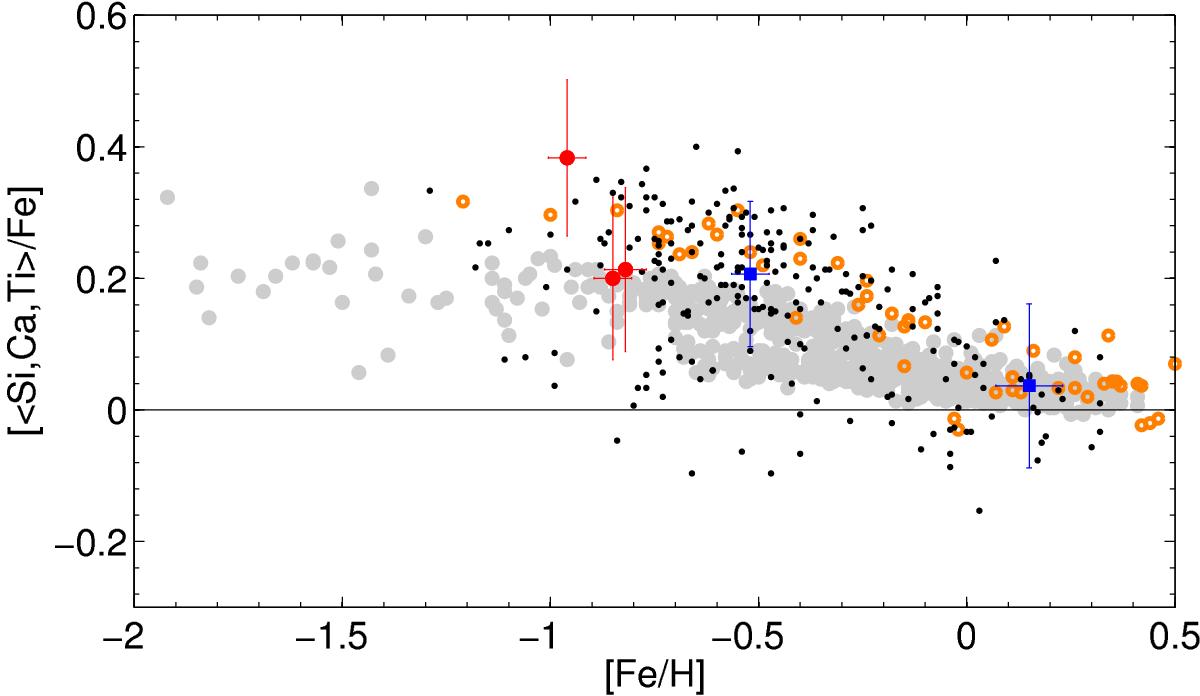
Averaged α-element abundances for our sample (black dots) in comparison with stars in the solar neighborhood from Bensby et al. (2014, light gray shade) and in the Galactic bulge (Bensby et al. 2013), shown in orange. The best cluster candidates, selected on grounds of their kinematics and position, are highlighted in red, while blue symbols denote the two stars with GC properties except for deviating abundances.
Current usage metrics show cumulative count of Article Views (full-text article views including HTML views, PDF and ePub downloads, according to the available data) and Abstracts Views on Vision4Press platform.
Data correspond to usage on the plateform after 2015. The current usage metrics is available 48-96 hours after online publication and is updated daily on week days.
Initial download of the metrics may take a while.