Fig. 10
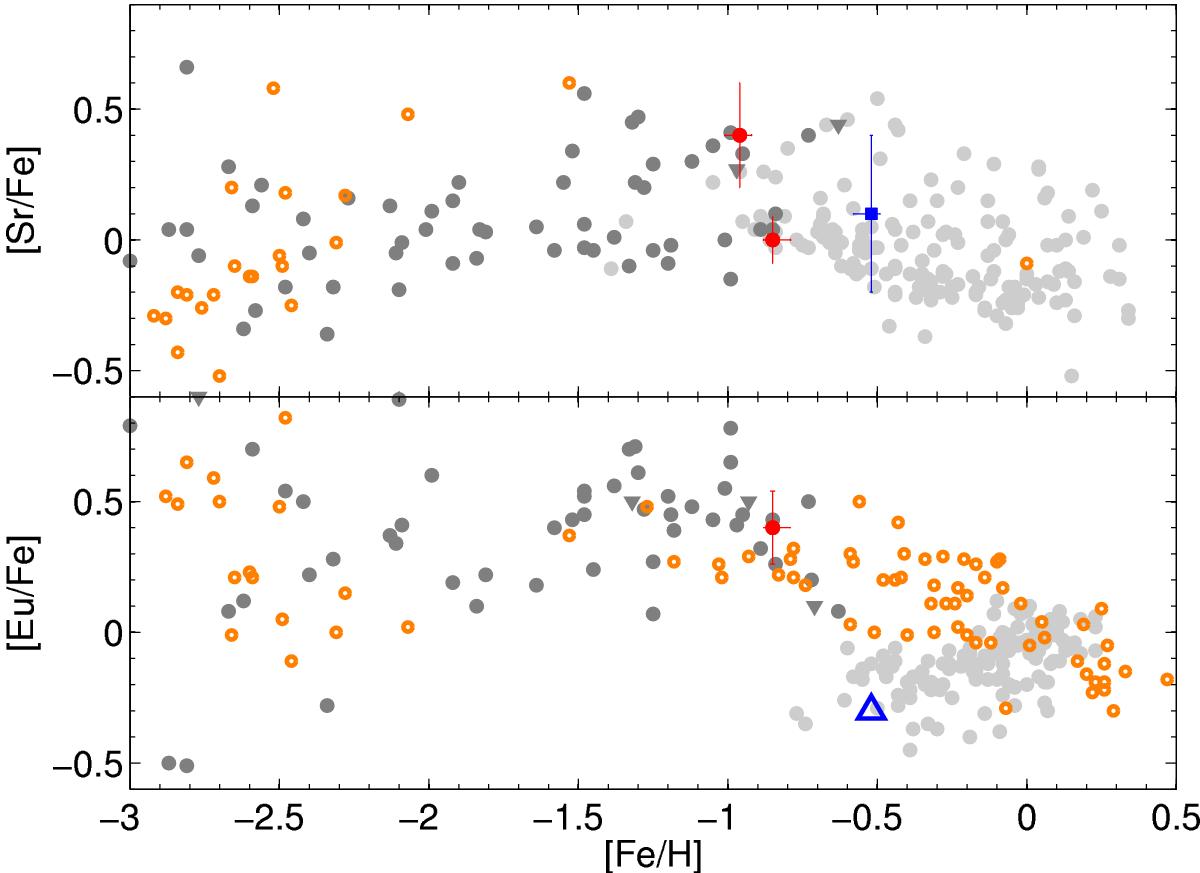
Abundance ratios for the n-capture elements Sr and Eu with literature data. As before, gray points denote disk and halo stars of Battistini & Bensby (2012, dark gray) and Battistini & Bensby 2016, light gray) for Sr, and Hansen et al. (2012, dark gray) and Koch & Edvardsson (2002, light gray) for Eu. Orange dots show the bulge component (Johnson et al. 2012), extending to the metal-poor bulge below [Fe/H] <−2 dex (Casey & Schlaufman 2015; Howes et al. 2016; Koch et al. 2016).
Current usage metrics show cumulative count of Article Views (full-text article views including HTML views, PDF and ePub downloads, according to the available data) and Abstracts Views on Vision4Press platform.
Data correspond to usage on the plateform after 2015. The current usage metrics is available 48-96 hours after online publication and is updated daily on week days.
Initial download of the metrics may take a while.