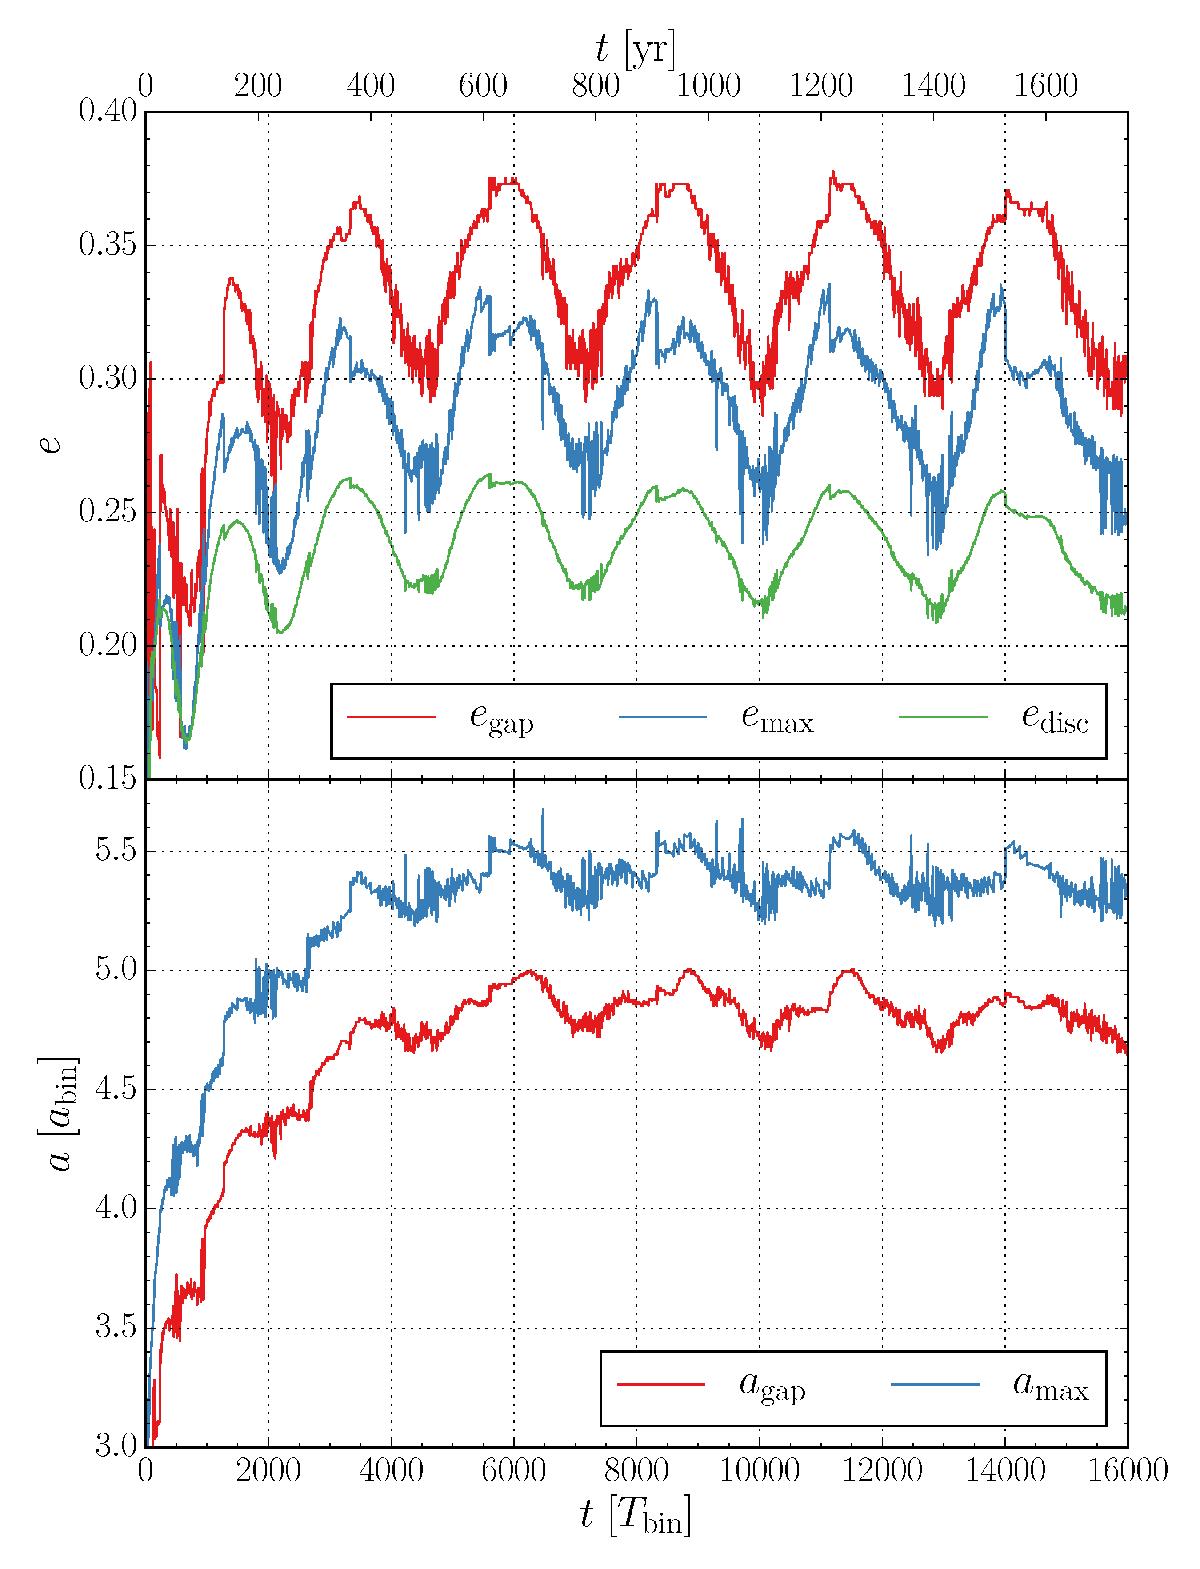
Fig. 9

Evolution of gap eccentricity (top) and semi-major axis (bottom) for a binary with ebin = 0.30. Shown are different measurements for the disc eccentricity. The red lines (egap and agap) show the eccentricity and semi-major axis of the geometrically fitted ellipses, see Fig. 8. The blue lines (emax and amax) show the eccentricity and semi-major axis of the cell with the maximum surface density. The green curve shows the averaged eccentricity of the inner disc. Since the gap size varies with time we use R2 = RΣmax in Eq. (18)to calculate the inner disc eccentricity.
Current usage metrics show cumulative count of Article Views (full-text article views including HTML views, PDF and ePub downloads, according to the available data) and Abstracts Views on Vision4Press platform.
Data correspond to usage on the plateform after 2015. The current usage metrics is available 48-96 hours after online publication and is updated daily on week days.
Initial download of the metrics may take a while.


