Fig. 8
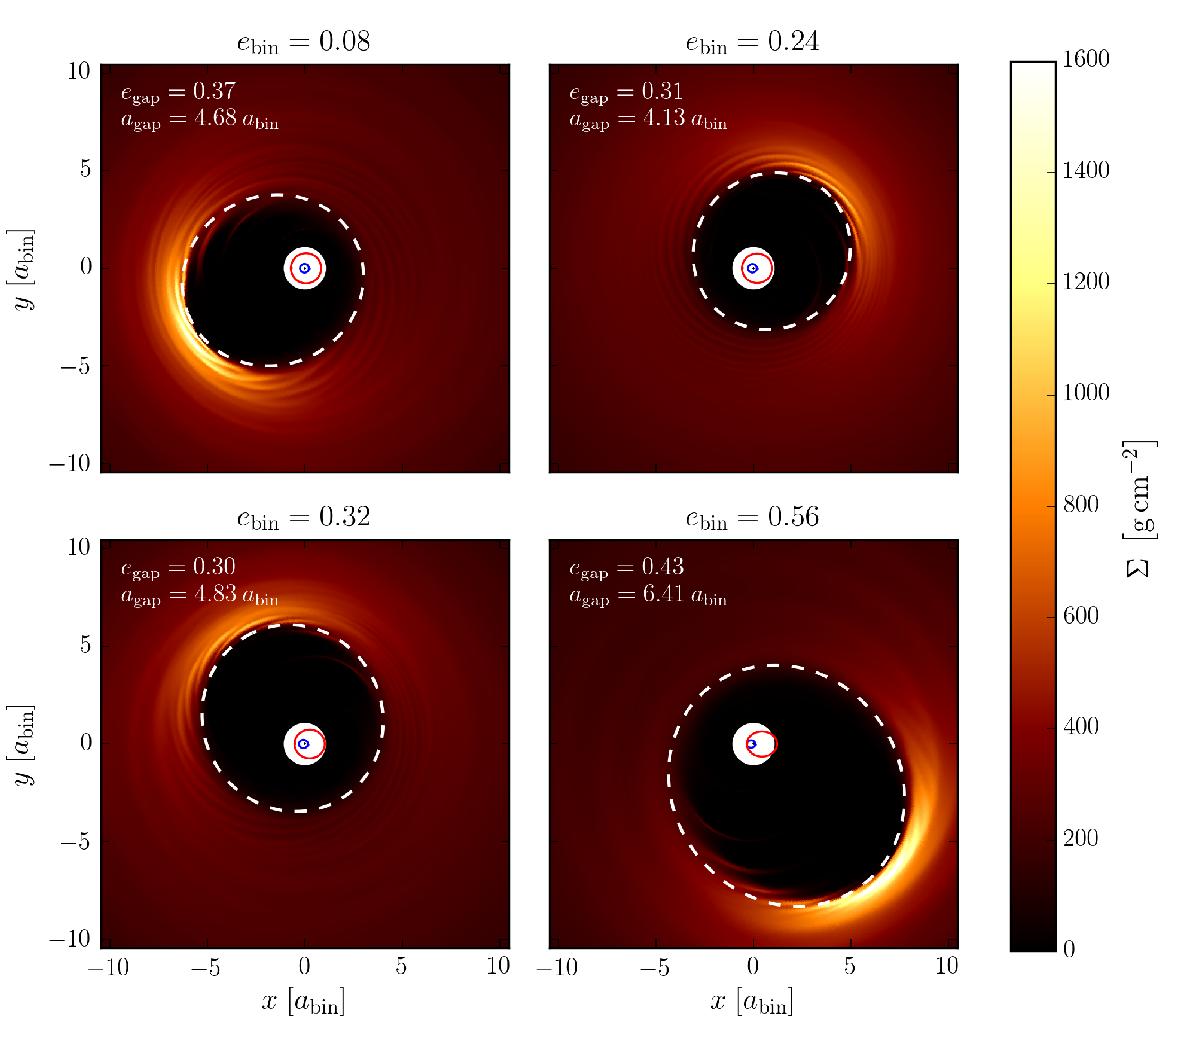
Structure of the inner disc for different binary eccentricities after 16 000 binary orbits. The surface density is colour-coded in cgs-units. The orbits of the primary and secondary around the centre of mass (central point) are shown in blue and red. The white dashed lines represent approximate ellipses fitted to match the extension of the inner gap (see explanation in text). Videos of these simulations can be found online.
Current usage metrics show cumulative count of Article Views (full-text article views including HTML views, PDF and ePub downloads, according to the available data) and Abstracts Views on Vision4Press platform.
Data correspond to usage on the plateform after 2015. The current usage metrics is available 48-96 hours after online publication and is updated daily on week days.
Initial download of the metrics may take a while.