Fig. A.1
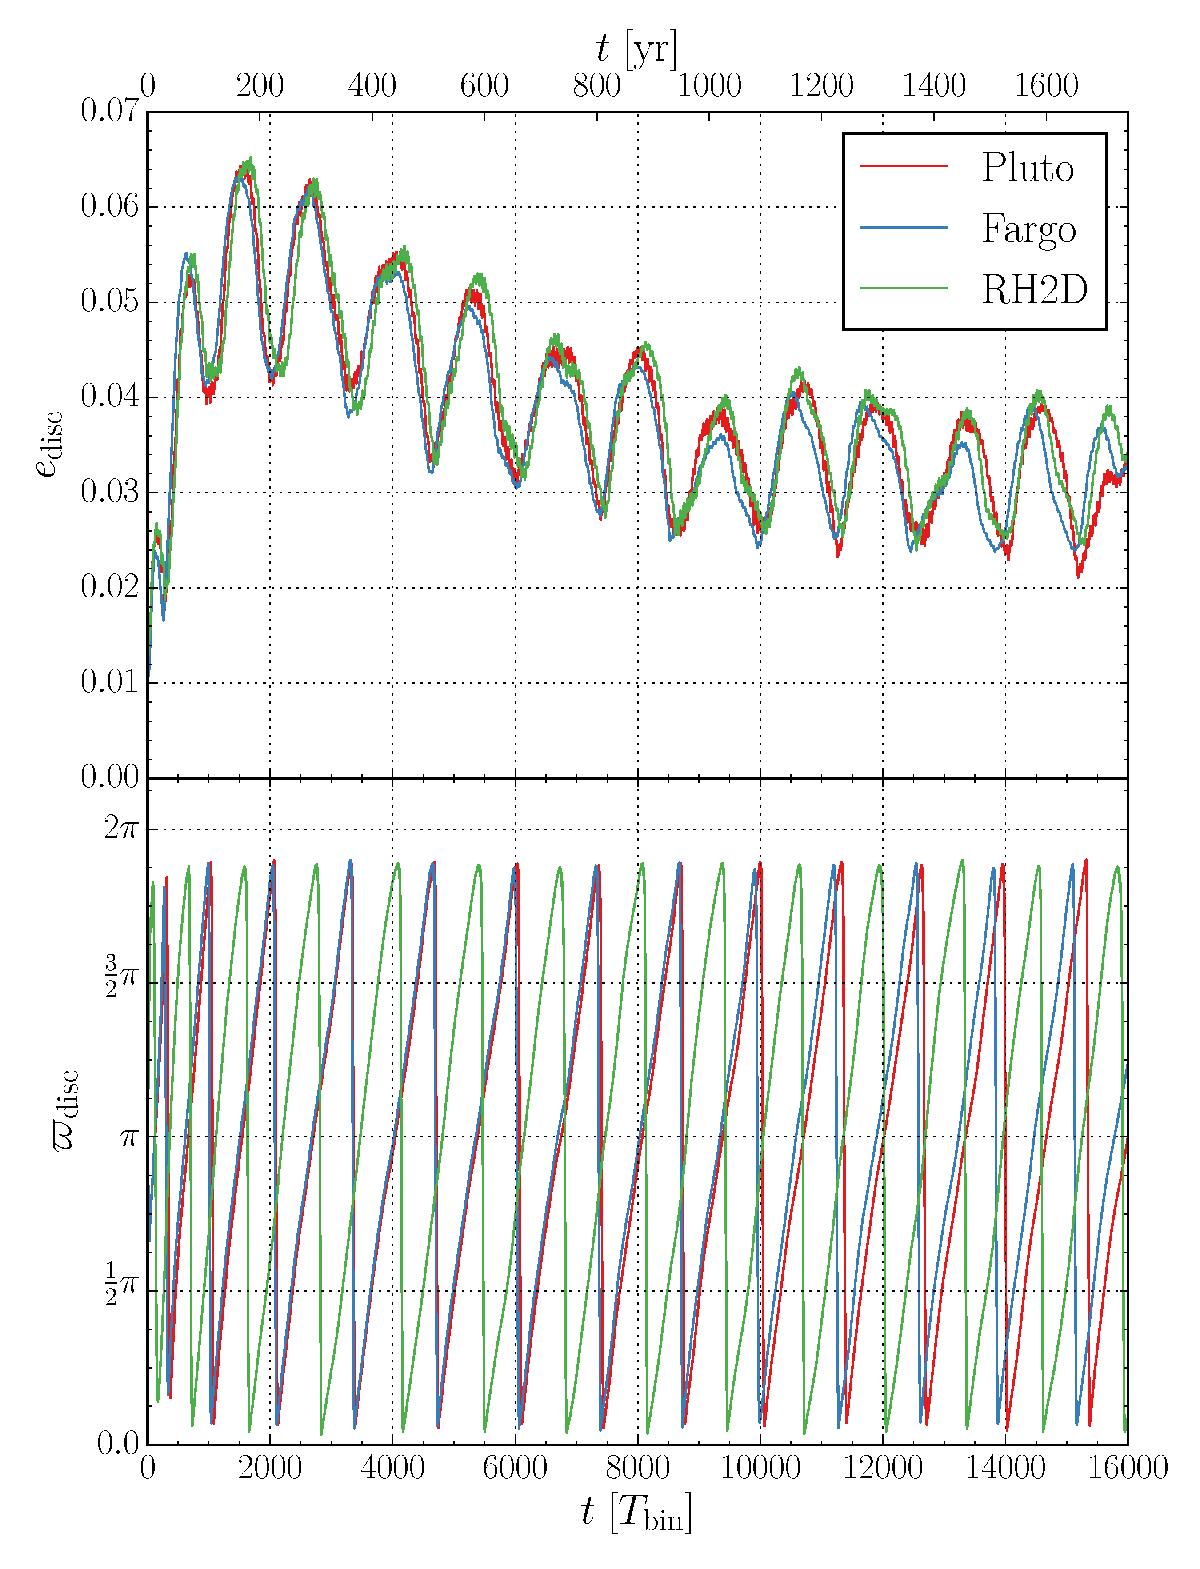
Comparison of disc eccentricity (top) and disc longitude of pericentre (bottom) for the standard model. The disc eccentricity was calculated by summing over the whole disc (R2 = Rmax in Eq. (18)), whereas the disc longitude of pericentre was calculated only for the inner disc (R2 = 1.0 au in Eq. (19)). The π-shift of the green curve in the bottom panel is explained in the text. We used a resolution of 512 × 580 grid cells for Pluto simulations and for Fargo and Rh2d simulations a resolution of 448 × 512.
Current usage metrics show cumulative count of Article Views (full-text article views including HTML views, PDF and ePub downloads, according to the available data) and Abstracts Views on Vision4Press platform.
Data correspond to usage on the plateform after 2015. The current usage metrics is available 48-96 hours after online publication and is updated daily on week days.
Initial download of the metrics may take a while.