Fig. 1
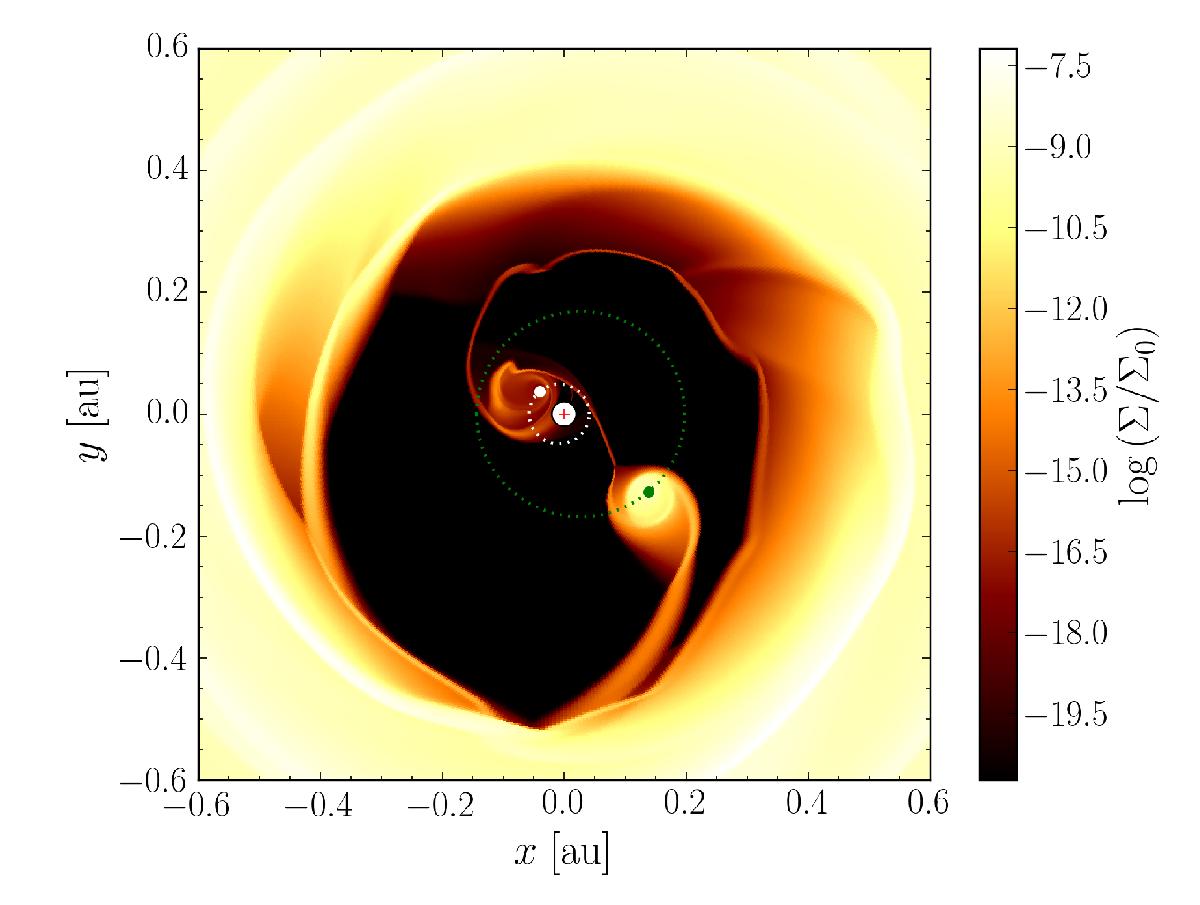
Two-dimensional plot of the inner disc of one of our locally isothermal Kepler-16 simulations where both orbits of the binary lie inside the computational domain. The logarithm of the surface density is colour-coded. The orbits of the primary and secondary are shown in white and green. The white inner region lies outside the computational domain; the red cross marks the centre of mass of the binary. A video of the simulation can be found online.
Current usage metrics show cumulative count of Article Views (full-text article views including HTML views, PDF and ePub downloads, according to the available data) and Abstracts Views on Vision4Press platform.
Data correspond to usage on the plateform after 2015. The current usage metrics is available 48-96 hours after online publication and is updated daily on week days.
Initial download of the metrics may take a while.