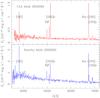
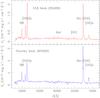
Fig. 3

One-dimensional spectra (observed frame) of the ULX ANEPD-CXO104 (upper sections) and nearby blob (lower sections) obtained with OSIRIS/GTC. The left panel shows the spectra obtained with the R500B grism, while the right panel shows the spectra obtained with the R500R grism. Strong residual sky emission lines were removed from the spectra.
Current usage metrics show cumulative count of Article Views (full-text article views including HTML views, PDF and ePub downloads, according to the available data) and Abstracts Views on Vision4Press platform.
Data correspond to usage on the plateform after 2015. The current usage metrics is available 48-96 hours after online publication and is updated daily on week days.
Initial download of the metrics may take a while.