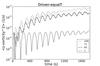
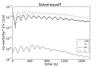
Fig. 9
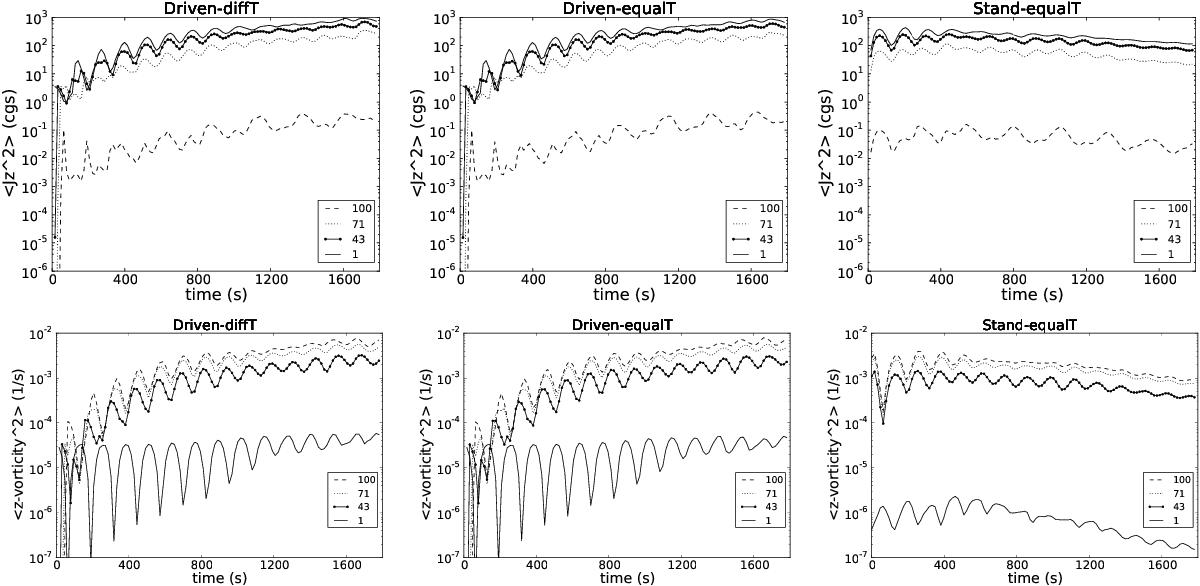
Top and bottom panels: time profiles for the average square z-current density ![]() and the average square z-vorticity
and the average square z-vorticity ![]() , respectively, at different heights. The apex is located at z = 100 Mm and the volume averaging takes place only inside each tube (ρ> 0.335 ρi). From left to right: a) the Driven-diffT model; b) the Driven-equalT model and c) the Stand-equalT model.
, respectively, at different heights. The apex is located at z = 100 Mm and the volume averaging takes place only inside each tube (ρ> 0.335 ρi). From left to right: a) the Driven-diffT model; b) the Driven-equalT model and c) the Stand-equalT model.

Current usage metrics show cumulative count of Article Views (full-text article views including HTML views, PDF and ePub downloads, according to the available data) and Abstracts Views on Vision4Press platform.
Data correspond to usage on the plateform after 2015. The current usage metrics is available 48-96 hours after online publication and is updated daily on week days.
Initial download of the metrics may take a while.