Free Access
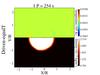
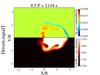
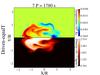
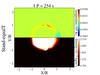
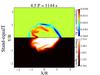
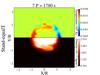
Fig. 5
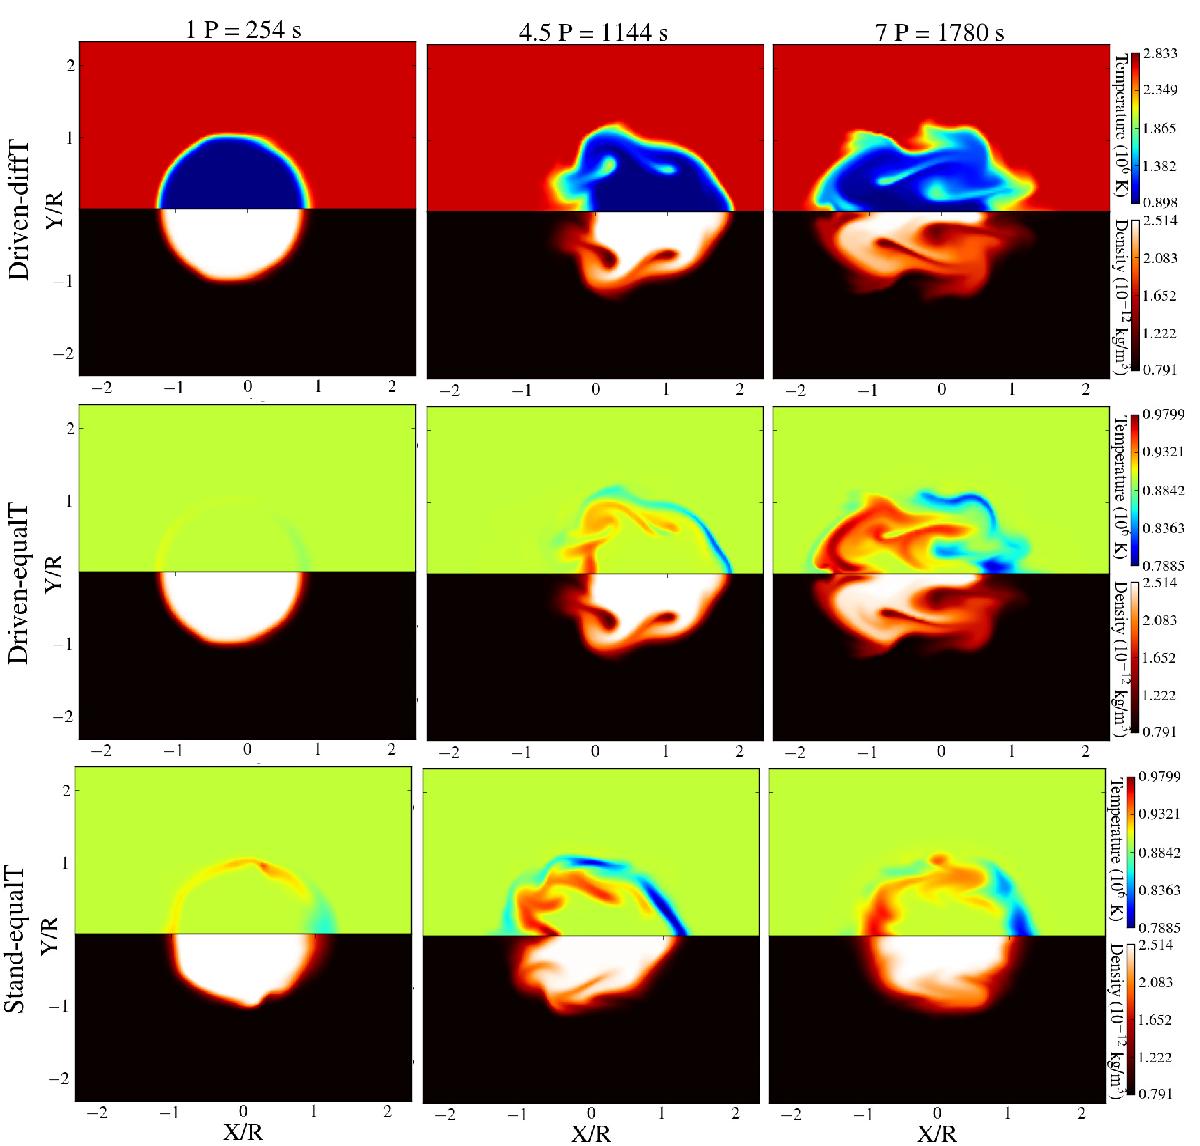
Cross-section of the apex (z = 100 Mm) showing the (upper half) temperature and (lower half) density profile for the three different models we studied. From top to bottom: a) the Driven-diffT model; b) the Driven-equalT model and c) the Stand-equalT model.
This figure is made of several images, please see below:
Current usage metrics show cumulative count of Article Views (full-text article views including HTML views, PDF and ePub downloads, according to the available data) and Abstracts Views on Vision4Press platform.
Data correspond to usage on the plateform after 2015. The current usage metrics is available 48-96 hours after online publication and is updated daily on week days.
Initial download of the metrics may take a while.