Fig. 1
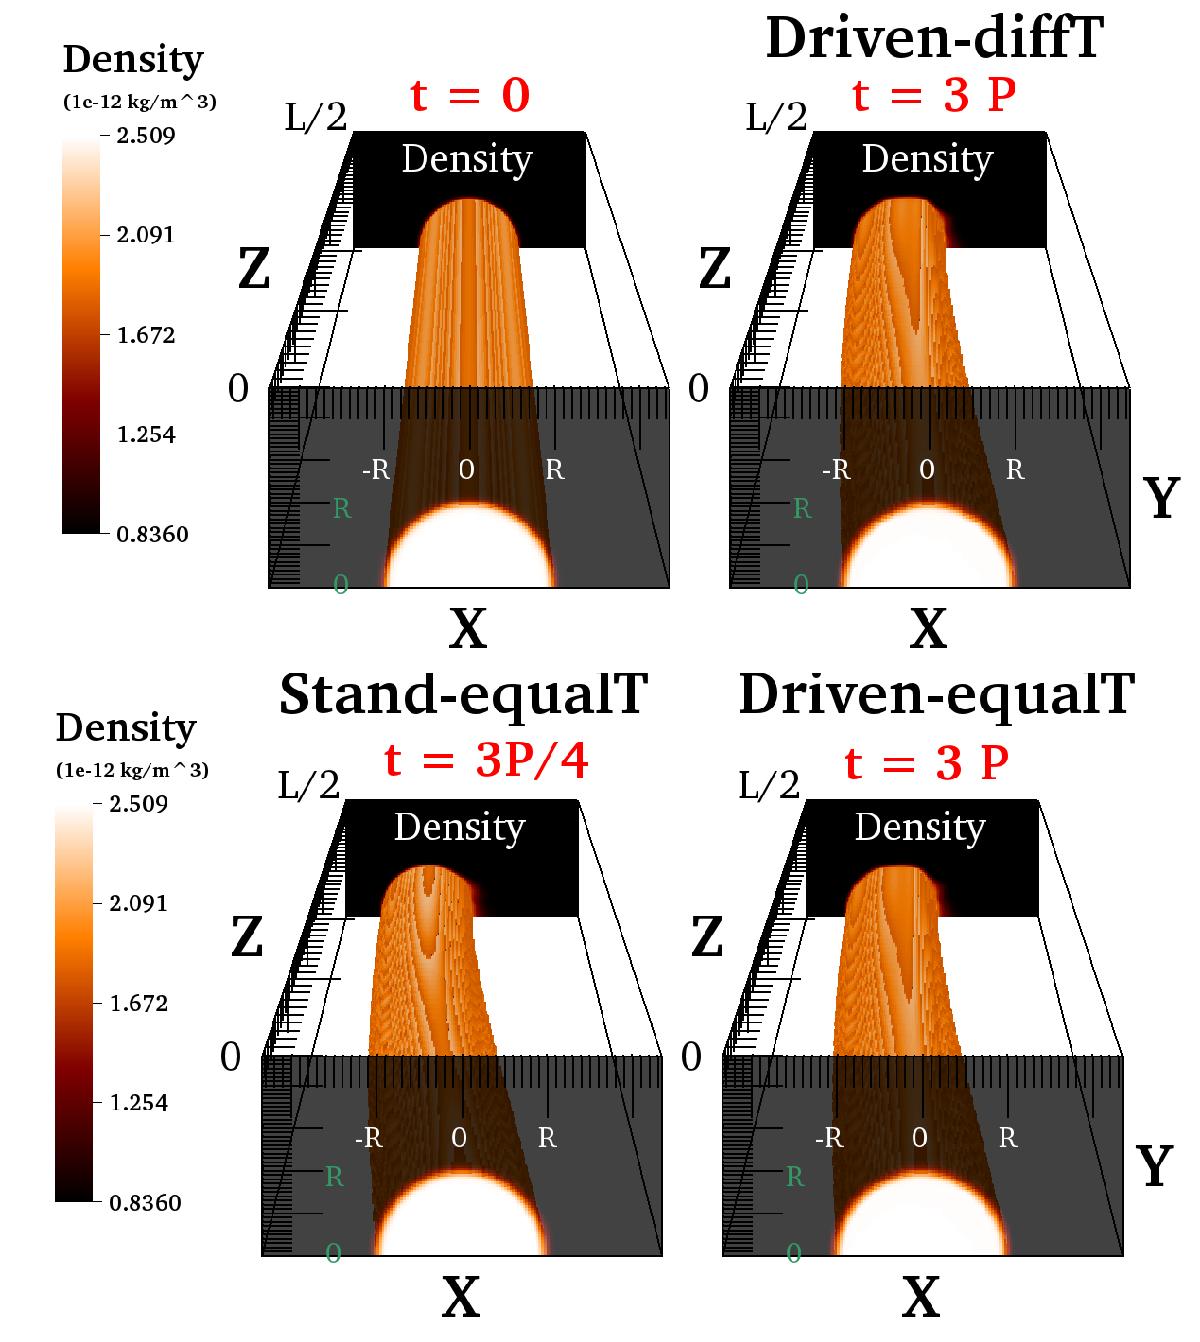
3D density plot, measured in 10-12 kg/m3, of our basic setup (t = 0), and of the three different models at later times. The cross sections on the x − y planes at the footpoint (z = 0) and the apex (z = L/ 2 = 100 Mm) are shown. The region with the highest refinement level is defined by 0 ≤ z ≤ 100 Mm, | x | ≤ 2.33 Mm and y ≤ 2.33 Mm. Animations of these figures, showing the oscillations for the three models, are available online (movies 1–3).

Current usage metrics show cumulative count of Article Views (full-text article views including HTML views, PDF and ePub downloads, according to the available data) and Abstracts Views on Vision4Press platform.
Data correspond to usage on the plateform after 2015. The current usage metrics is available 48-96 hours after online publication and is updated daily on week days.
Initial download of the metrics may take a while.