Fig. 9
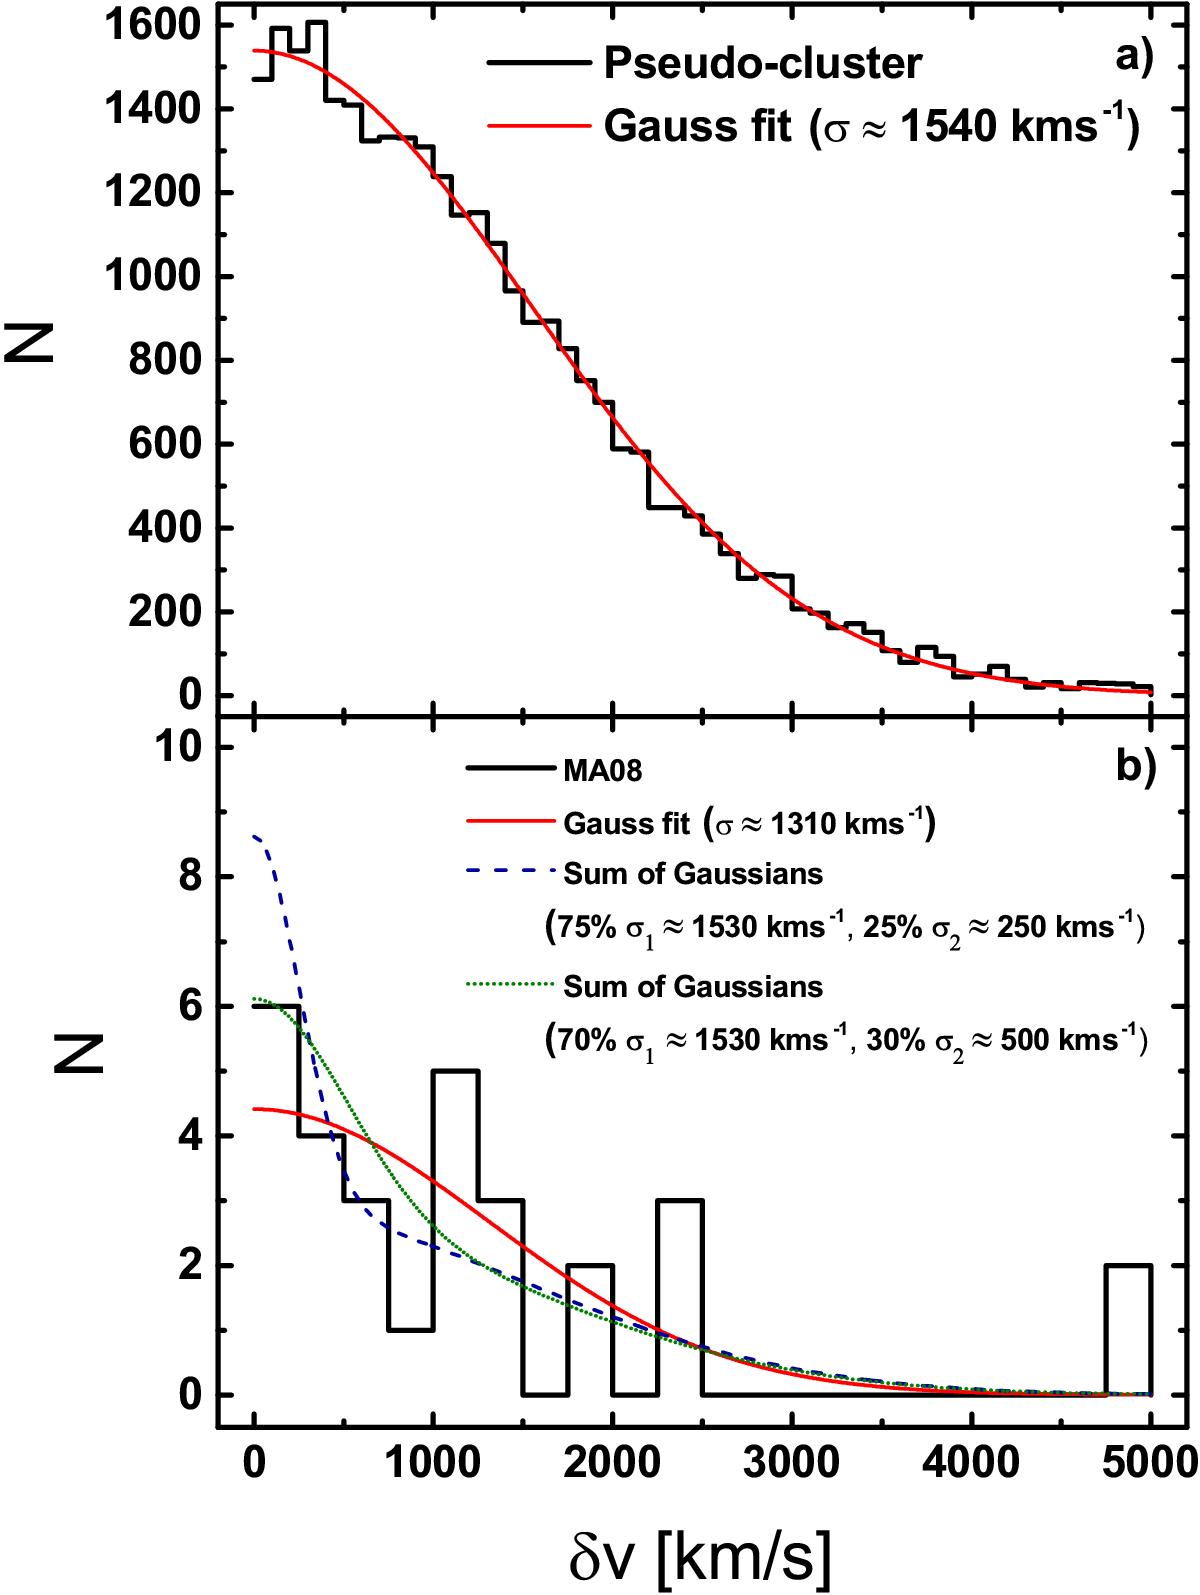
Histogram of δv for the 1000 pseudo-clusters (panel a) and for the IFerg> 2 pairs in the MA08 data (panel b). Both histograms are overlaid with a best-fitting Gauss curve (red). For the MA08 data two combinations of Gauss distributions representing a population of bound pairs and one of projected pairs are drawn as well (dashed and dotted curves in panel b). The area under each curve is always normalized to the total number of galaxies involved.
Current usage metrics show cumulative count of Article Views (full-text article views including HTML views, PDF and ePub downloads, according to the available data) and Abstracts Views on Vision4Press platform.
Data correspond to usage on the plateform after 2015. The current usage metrics is available 48-96 hours after online publication and is updated daily on week days.
Initial download of the metrics may take a while.