Fig. 5
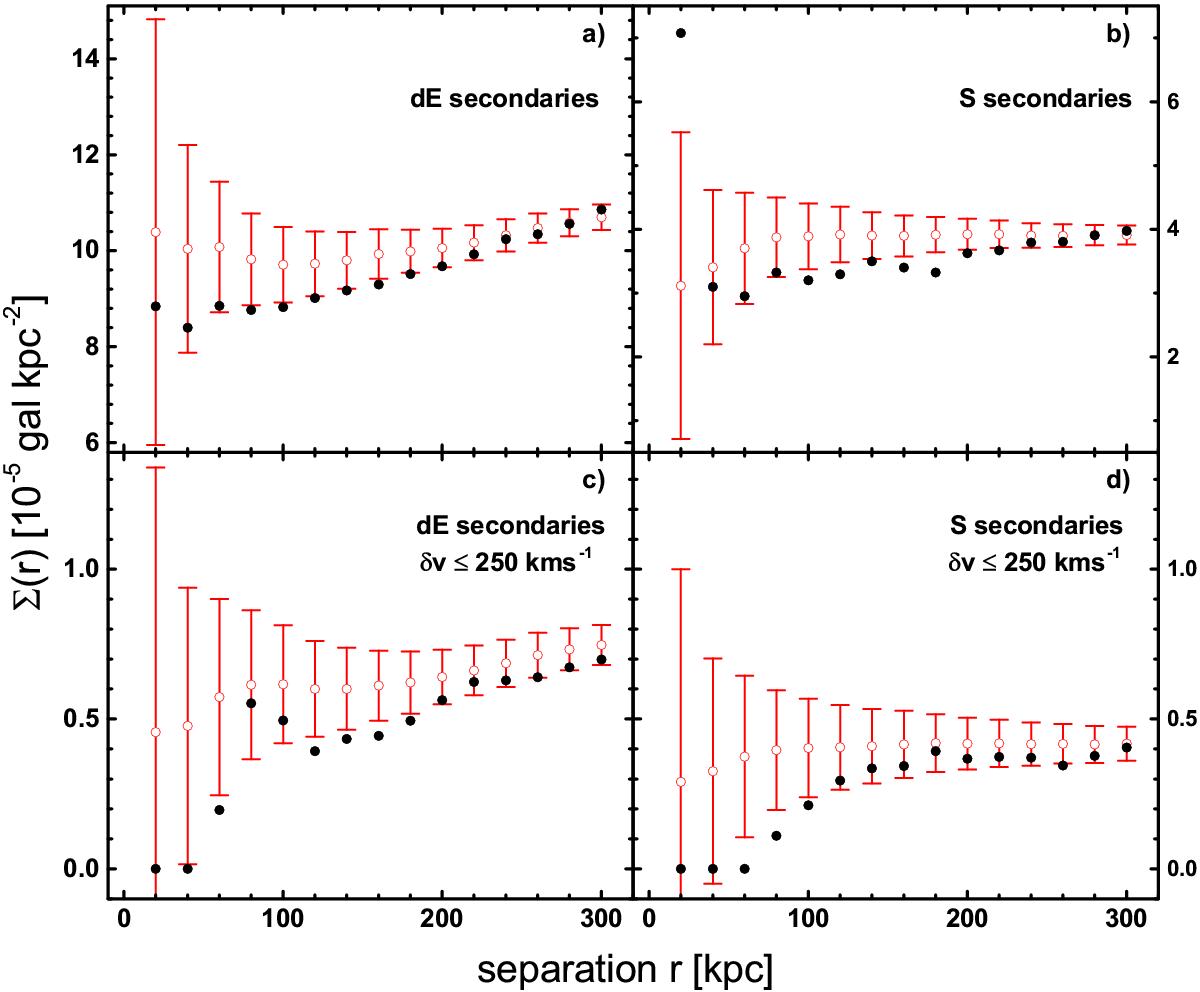
Mean density of dwarf elliptical (dE, left panels) and spiral (S, right panels) secondaries around all primaries. In the lower panels the same is shown for primary-secondary pairs with a small velocity difference δv< 250 km s-1 only. Full black dots represent the data; colored open circles and error bars the mean and standard deviation of 1000 pseudo-clusters.
Current usage metrics show cumulative count of Article Views (full-text article views including HTML views, PDF and ePub downloads, according to the available data) and Abstracts Views on Vision4Press platform.
Data correspond to usage on the plateform after 2015. The current usage metrics is available 48-96 hours after online publication and is updated daily on week days.
Initial download of the metrics may take a while.