Fig. 3
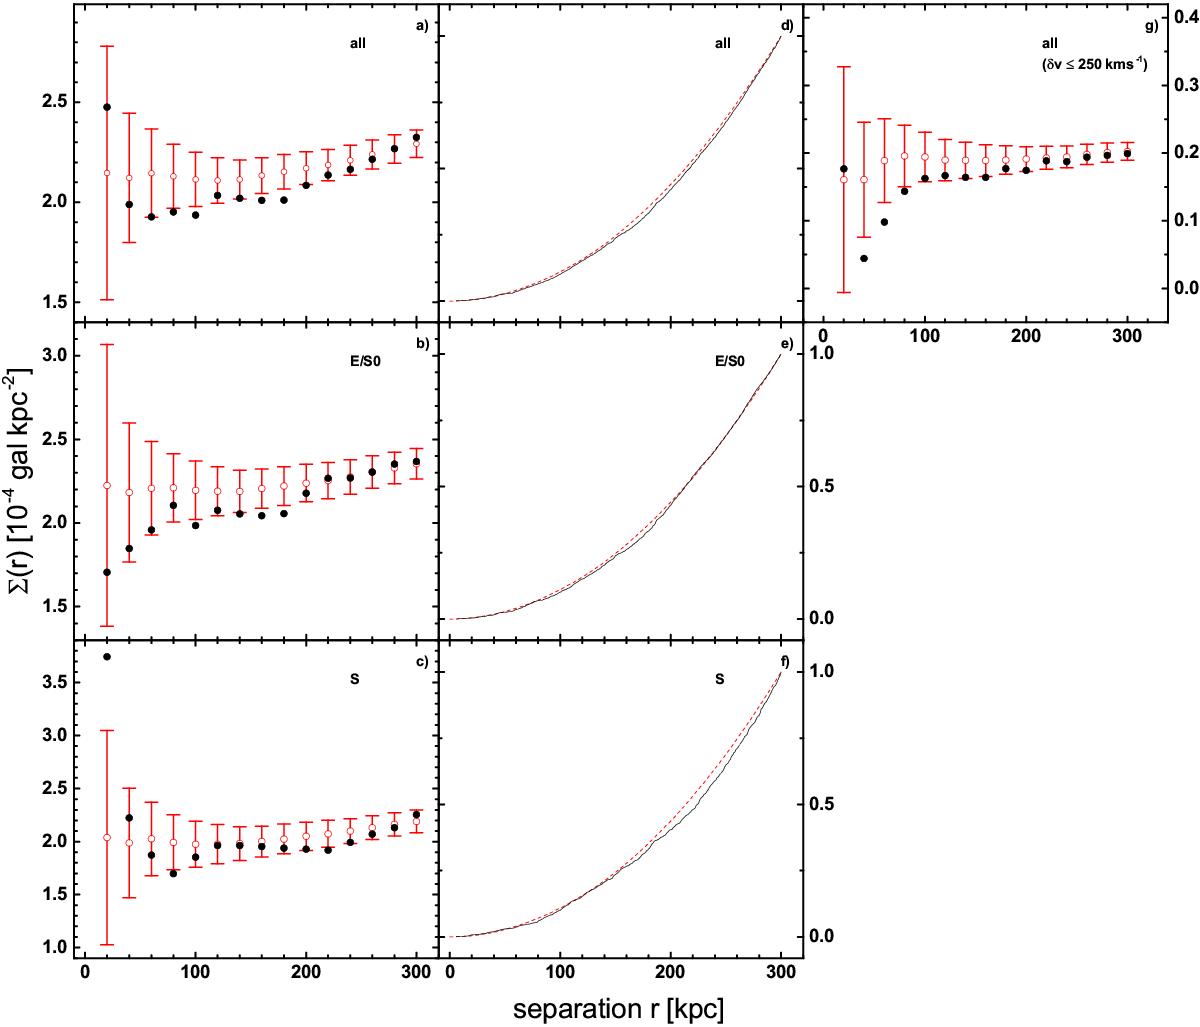
a)–c) Mean density of secondaries around primaries depending on their separation r. It should be noted that the ri do not indicate annular bins. Σ(ri) represents the number of secondaries within a circle of radius ri (Sect. 3.2). Black dots indicate the values for the MA08 set, the open circles and error bars (in red) show the mean and standard deviation of 1000 pseudo-clusters – a) whole sample, b) early-type primaries only, c) late-type primaries only. d)–f) Cumulative distribution of primary-secondary separations r for the MA08 data (black) and 1000 pseudo-clusters (dashed, red) – d) whole sample, e) early-type primaries only, f) late-type primaries only. g) The same as a) but restricted to galaxies with velocity difference smaller than 250 km s-1.
Current usage metrics show cumulative count of Article Views (full-text article views including HTML views, PDF and ePub downloads, according to the available data) and Abstracts Views on Vision4Press platform.
Data correspond to usage on the plateform after 2015. The current usage metrics is available 48-96 hours after online publication and is updated daily on week days.
Initial download of the metrics may take a while.