Free Access
Fig. 10
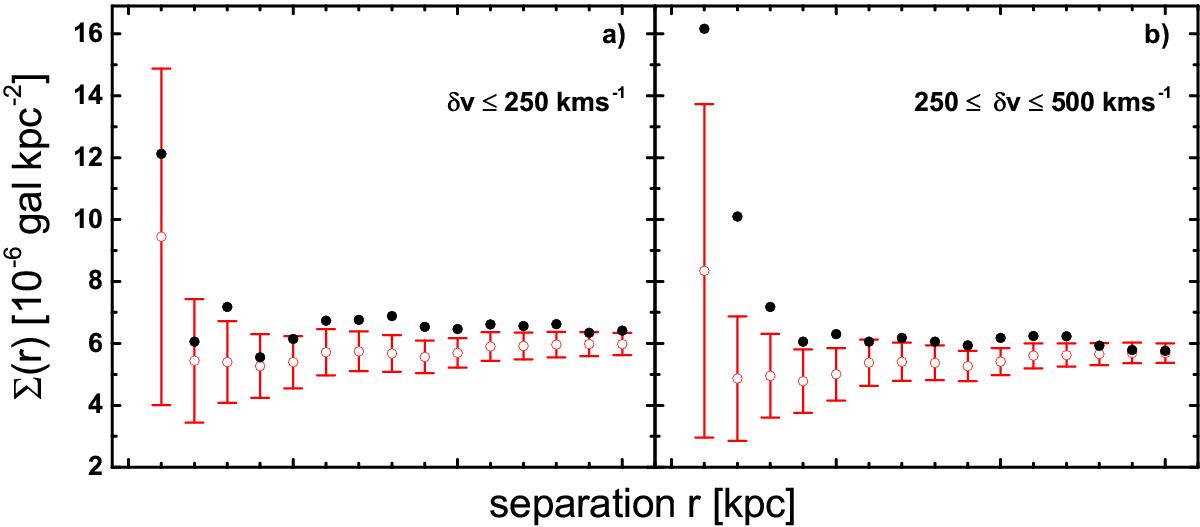
Mean density of secondaries around primaries for the complete WLG11 set, separated into two bins of velocity difference as indicated in the panels. Black dots represent the data; open circles and error bars in red give the mean and standard deviation of 1000 pseudo-clusters created by shuffling primary velocities.
Current usage metrics show cumulative count of Article Views (full-text article views including HTML views, PDF and ePub downloads, according to the available data) and Abstracts Views on Vision4Press platform.
Data correspond to usage on the plateform after 2015. The current usage metrics is available 48-96 hours after online publication and is updated daily on week days.
Initial download of the metrics may take a while.