Free Access
Fig. 6
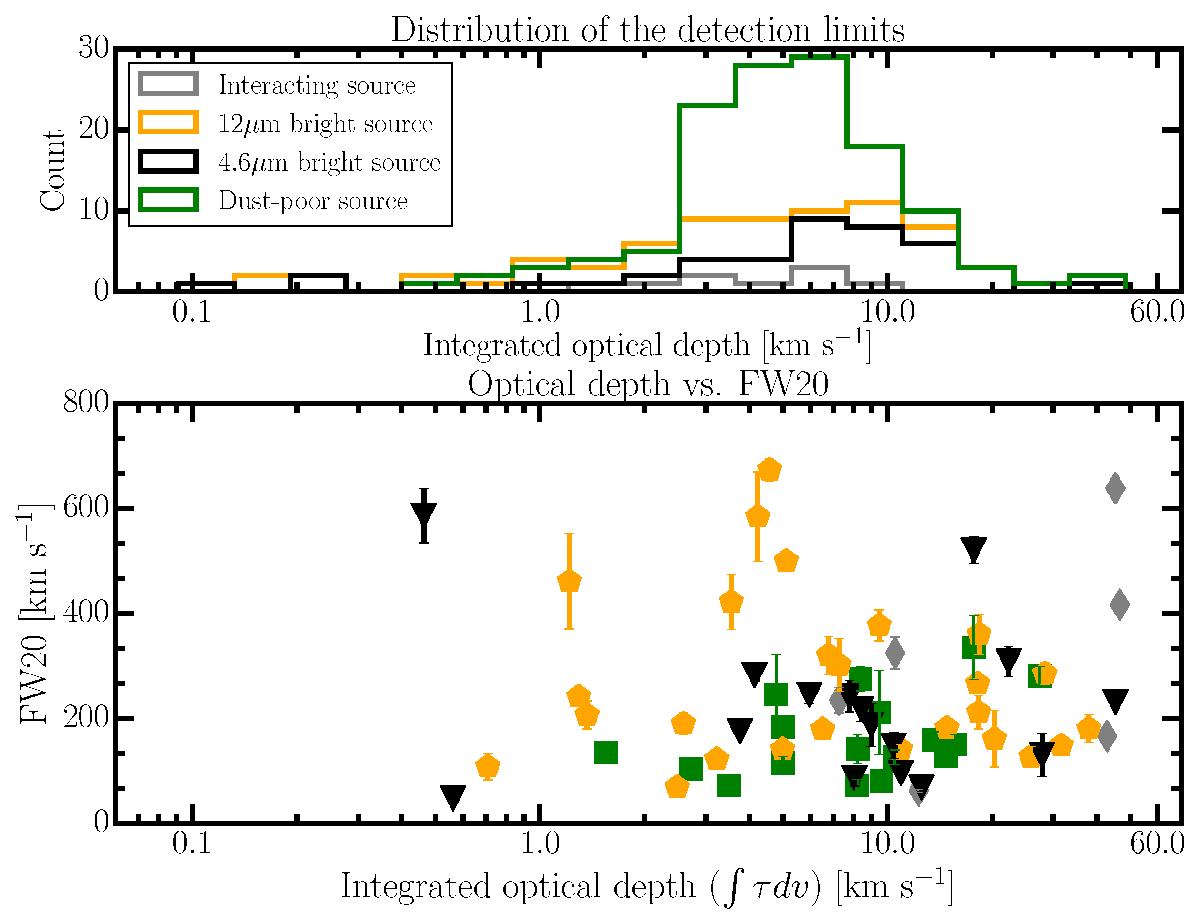
Full-width at 20% of the intensity (FW20) vs. the integrated optical depth of the H i lines (∫τdv). Symbols follow the WISE colour–colour classification shown in Fig. 1. The histogram in the top panel shows the distribution of the 3σ detection limit in optical depth for the non-detections of the each subsample.
Current usage metrics show cumulative count of Article Views (full-text article views including HTML views, PDF and ePub downloads, according to the available data) and Abstracts Views on Vision4Press platform.
Data correspond to usage on the plateform after 2015. The current usage metrics is available 48-96 hours after online publication and is updated daily on week days.
Initial download of the metrics may take a while.