Fig. 5
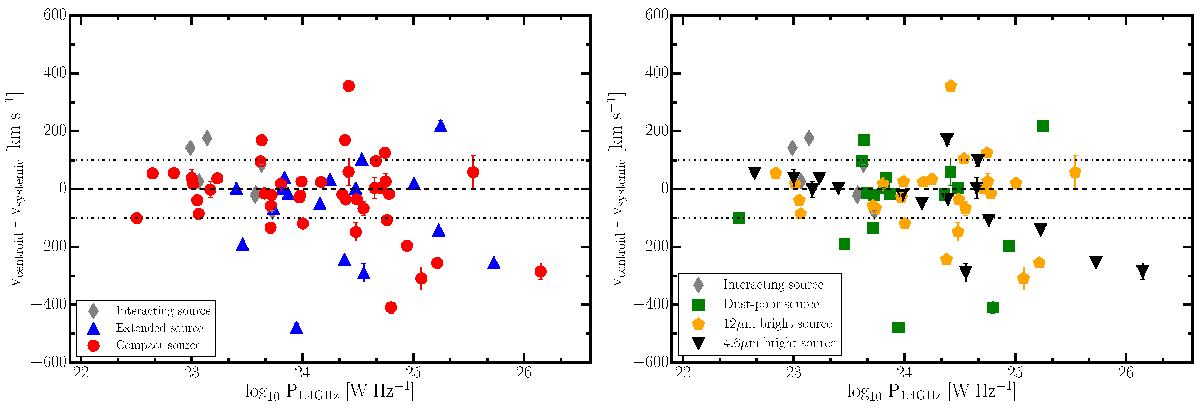
Left panel: blue shift and red shift of the H i line centroid with respect to the systemic velocity vs. the radio power of the sources. Sources are classified according to the extent of their radio continuum (see Fig. 2). The fine dashed lines indicate the ± 100 km s-1 velocities. Right panel: same as in the left panel with symbols following the WISE colour–colour plot shown in Fig. 1.
Current usage metrics show cumulative count of Article Views (full-text article views including HTML views, PDF and ePub downloads, according to the available data) and Abstracts Views on Vision4Press platform.
Data correspond to usage on the plateform after 2015. The current usage metrics is available 48-96 hours after online publication and is updated daily on week days.
Initial download of the metrics may take a while.