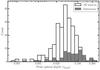
Fig. 3
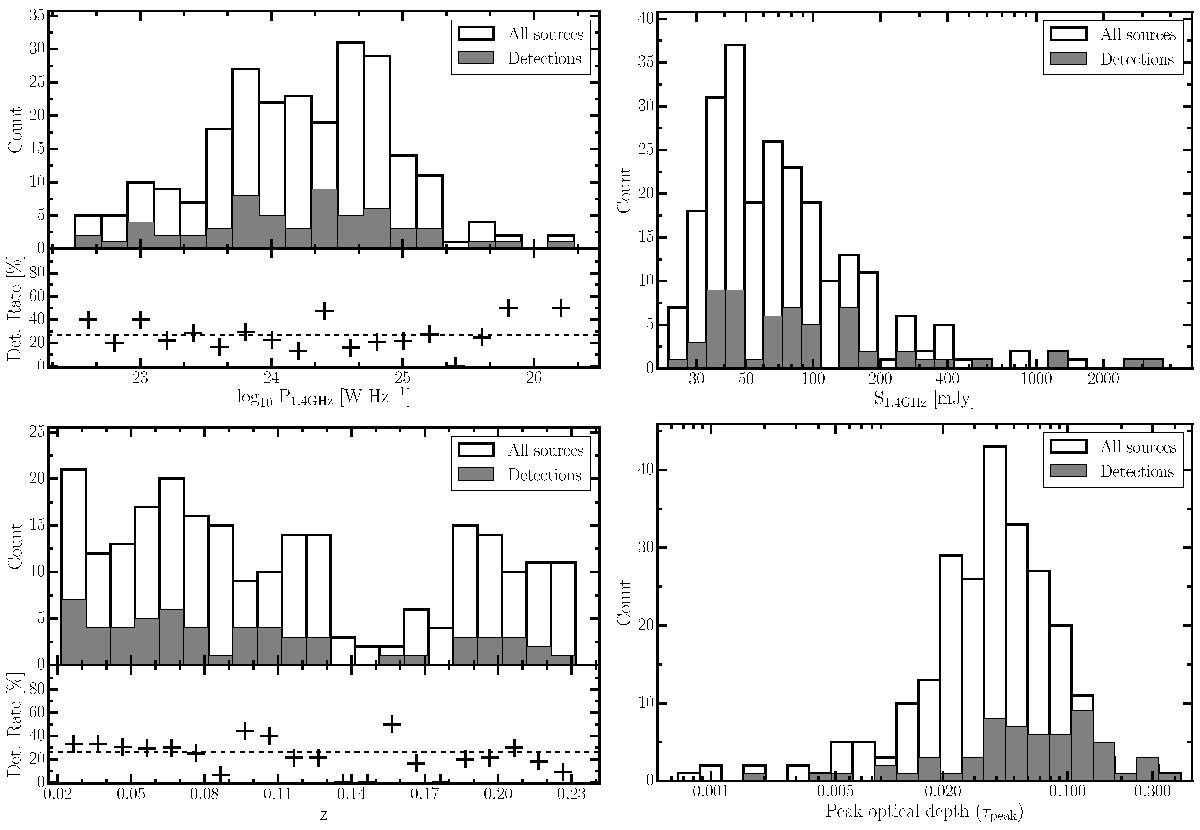
Top left panel: radio power distribution of the full sample and the detections. The sub-panel below shows the detection rate for each bin of the histogram and the average detection rate (dashed line). Top right panel: radio continuum flux (S1.4 GHz) distribution of the full sample (open bars) and of the detections (grey bars). Bottom left panel: redshift (z) distribution of the full sample of 248 radio sources and of the H i detections. The sub-panel shows the detection rate for each bin of the histogram. Bottom right panel: distribution of the optical depth detection limits of the full sample overlaid with the distribution of the optical depth of the peak of the detected absorption lines.
Current usage metrics show cumulative count of Article Views (full-text article views including HTML views, PDF and ePub downloads, according to the available data) and Abstracts Views on Vision4Press platform.
Data correspond to usage on the plateform after 2015. The current usage metrics is available 48-96 hours after online publication and is updated daily on week days.
Initial download of the metrics may take a while.